Preface: Explaining our market timing models
We maintain several market timing models, each with differing time horizons. The “Ultimate Market Timing Model” is a long-term market timing model based on the research outlined in our post, Building the ultimate market timing model. This model tends to generate only a handful of signals each decade.
The Trend Asset Allocation Model is an asset allocation model that applies trend-following principles based on the inputs of global stock and commodity prices. This model has a shorter time horizon and tends to turn over about 4-6 times a year. The performance and full details of a model portfolio based on the out-of-sample signals of the Trend Model can be found here.

My inner trader uses a trading model, which is a blend of price momentum (is the Trend Model becoming more bullish, or bearish?) and overbought/oversold extremes (don’t buy if the trend is overbought, and vice versa). Subscribers receive real-time alerts of model changes, and a hypothetical trading record of the email alerts is updated weekly here. The hypothetical trading record of the trading model of the real-time alerts that began in March 2016 is shown below.

The latest signals of each model are as follows:
- Ultimate market timing model: Buy equities [upgrade]
- Trend Model signal: Bullish [upgrade]
- Trading model: Neutral [upgrade]
Update schedule: I generally update model readings on my site on weekends. I am also on Twitter at @humblestudent and on Mastodon at @humblestudent@toot.community. Subscribers receive real-time alerts of trading model changes, and a hypothetical trading record of those email alerts is shown here.
Subscribers can access the latest signal in real-time here.
Positive or negative divergence?
Several readers pointed out to me that while the short-term breadth indicators like the percentage of S&P 500 above their 20 and 50 dma are exhibiting negative divergences, the longer-term percentage of S&P 500 above their 200 dma has been far more resilient. In fact, the strength of the percentage above 200 dma is a signal of underlying strength.

Is the market showing positive or negative divergences?
The bull case
While I have been cautious on the market, here is the bull case. Rob Anderson of Ned Davis Research pointed out that the percentage of stocks above their 200 dma rose above 61%, which is an indication of broad market strength, which is historically bullish.

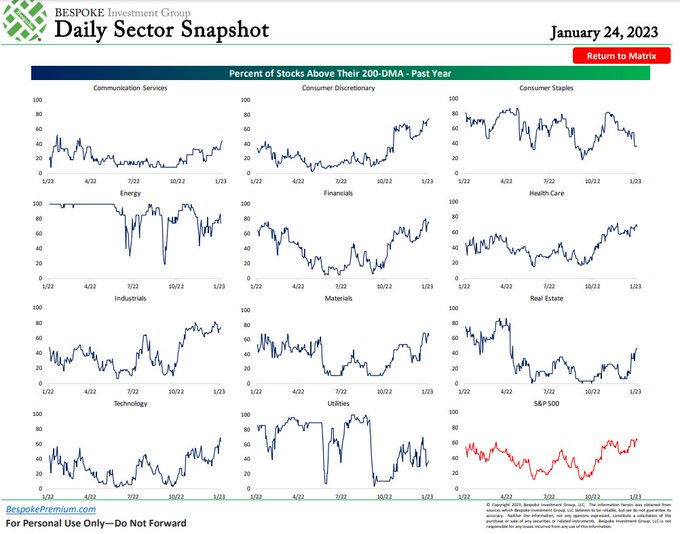
Bespoke drilled down further by sector and found that the percentage of stocks above their 200 dma is strong among cyclical sectors and weak among defensive sectors, which is another bullish signal.
Across the Atlantic, European value sectors are also exhibiting signs of relative strength, with industrials and financials in the lead.

A Trend Model upgrade
In connection with my other publication this week (see FOMC preview: How and why the Fed could pivot) and these technical readings, I am upgrading the Trend Asset Allocation Model from neutral to bullish. The caveat is most of the strength is likely to be found outside the US, in Europe, and in emerging markets.

An analysis of the iMGP DBi Managed Futures Strategy ETF as a proxy for trend following systematic CTAs shows that the fund is significantly short interest rate futures, short the S&P 500, and have minor long positions in EAFE and emerging market equities. As trend following programs like this CTA and my Trend Asset Allocation Model are designed to be slow to enter and exit positions in order to take advantage of long-term trends, I interpret these readings as the bull trend has more room to run.

The Trend Model upgrade also means that the Ultimate Market Timing Model is now bullish, with the caveat that the S&P 500 may have to re-revisit the old October lows.
A rising tide lifts all boats, but…
Don’t get me wrong, US equities are likely to be dragged upwards by the global bull wave especially when the S&P 500 has decisively staged an upside breakout through a falling trend line.

In the short-term, the S&P 500 is encountering overhead resistance. However, the equal-weighted S&P 500, the mid-cap S&P 400, and the small-cap Russell 2000 have all staged upside breakouts. How the US market behaves this coming week with the FOMC decision Wednesday, the January Payroll Report Friday, and a significant portion of the S&P 500 reporting results could be decisive.

That said, US equity investors are warned of elevated downside risk compared to non-US markets. The US is trading at a significant valuation premium compared to other markets around the world.

Moreover, the elevated forward P/E ratio is based on an assumption of a soft landing. Consensus estimates indicate that EPS deterioration should end in Q1 and earnings should return to growth in Q2. As earnings estimates are being revised downwards across almost all time horizons, the risk is the earnings recession extends into Q2 and beyond.

The big picture is Q4 earnings season results have been subpar. Sales and EPS beat rates are below historical averages even as Street analysts downgrade forward EPS estimates.

This report began with the divergence between short and long-term indicators. I interpret these readings as the S&P 500 may need a period of consolidation or pullback within a longer-term bull trend. The best opportunities are to be found within cyclical stocks and in non-US regions.
I am not as complex. I just can’t wrap my head around a bullish case.
I think this is a bear market rally. We have to deal with debt, public, private, zombie companies, housing market getting hammered, people being houselocked by mortgage spreads…who wants to step out of a 2.875 30 year fixed and take on something in the 7’s?
I don’t remember back in the 70s very clearly, but as I recall, there was not all this Fed Pivot and stuff. Of course we did not have this incredible communication of the internet, but all this Fed pivot talk is just that, talk. If the market were healthy, we would ignore rates. Many times with a bull market rates are rising. The focus on the FED is a sign of a weak market, needing a boost.
The boost may come, just like markets in Weimar Germany went up during hyperinflation, but until the $SPX goes higher longer, I’m still worried and not trusting prices.
As a Canadian I was not well versed in American mortgages other than knowing interest is tax deductible and a 30 year long-term mortgage could be repriced at a lower rate if rates went down.
As rates went down over the years, people redid their mortgages until they locked in an extremely low rate.
I wondered how portable these were and got an answer on the web that one can take your mortgage with you to the next house. Yodoc2003’s comment above says people are houselocked. Is he right? can you take your mortgage with you if you buy a new home. Can you sell your home and let the new owner keep your low-rate mortgage?
I’ve been mystified as to why the Home Builders ETF has been such an outperformer all year. If the mortgages are portable then new housing would not be effected by the 7% new mortgage rate if it is bought by a current home owner. Only first-time buyers would be effected by the big rise in rates.
Could the Americans on the blog let us know the rules?
I am not aware of the mortgages being portable in the US. If an homeowner buys a new house, s/he needs to get a new mortgage on new home at new rates.
One cannot sell a home and let the buyers keep the mortgage with the seller either.
I agree!
I am confused . Short term ( what is short term?), market consolidates or down, then market goes up (till end of Q2), may have a recession at that point.
Ultimate timing model turned bullish – buy equities.
I don’t think market fits into such neat timelines.
Cam,
You said that the S&P 500 may have to re-revisit the old October lows.
That’s a very specific target. What exactly are you seeing?
Ken, American 30 year fixed mortgages are most assuredly NOT portable. That’s one of the big problems with such a sudden and sharp rise in interest rates, i.e. people with 2.875% mortgages might have a monthly payment of $1600 for a mid-priced house, but if they sell and move to another one of the same price they’re faced with a $2600/month mortgage payment. This definitely “houselocks” many homeowners. Additionally, the rise in rates impacts the valuation of homes in every market in a negative manner, similar to the effect one sees in doing a discounted cash flow model using higher rates in the input. Net-net, home buyers in early 2022 paid very high prices, got very low interest rate mortgages, and are now trapped in houses with no equity and no buyers. Reminds me of the stock market tops in 2000 and 2007. Same principle, different asset class.