Preface: Explaining our market timing models
We maintain several market timing models, each with differing time horizons. The “
Ultimate Market Timing Model” is a long-term market timing model based on the research outlined in our post,
Building the ultimate market timing model. This model tends to generate only a handful of signals each decade.
The
Trend Asset Allocation Model is an asset allocation model that applies trend-following principles based on the inputs of global stock and commodity prices. This model has a shorter time horizon and tends to turn over about 4-6 times a year. The performance and full details of a model portfolio based on the out-of-sample signals of the Trend Model can be found
here.
My inner trader uses a
trading model, which is a blend of price momentum (is the Trend Model becoming more bullish, or bearish?) and overbought/oversold extremes (don’t buy if the trend is overbought, and vice versa). Subscribers receive real-time alerts of model changes, and a hypothetical trading record of the email alerts is updated weekly
here. The hypothetical trading record of the trading model of the real-time alerts that began in March 2016 is shown below.
The latest signals of each model are as follows:
- Ultimate market timing model: Sell equities
- Trend Model signal: Neutral
- Trading model: Bearish
Update schedule: I generally update model readings on my site on weekends. I am also on Twitter at @humblestudent and on Mastodon at @humblestudent@toot.community. Subscribers receive real-time alerts of trading model changes, and a hypothetical trading record of those email alerts is shown here.
Subscribers can access the latest signal in real-time here.
Do you believe in breadth thrusts?
Technical analysts recently became very excited when price momentum signals began to flash buy signals. Walter Deemer highlighted a simultaneous case of
breakaway momentum and
Whaley breadth thrust.
Ryan Detrick analyzed the 10-day NYSE advance-to-decline ratio and found strong historical results.
Should you trust the historical evidence of breadth thrusts? Opinions are varied.
Buy the dip?
The market entered last week in an overbought condition but pulled back. It’s not unusual to see stock prices pause after a breadth thrust buy signal. Does this present an opportunity to buy the dip?
A study of strong overbought conditions, as measured by the NYSE McClellan Oscillator (NYMO), doesn’t tell us much. There were six instances in the last 20 years when NYMO reached an overbought reading of 100 or more. The market continued to rise in three and declined in three. The results amounted to a coin toss.
Andrew Thrasher prefers the Reagan adage of “trust but verify”. He prefers to see clusters of breadth thrusts, which was not in evidence in the current instance.
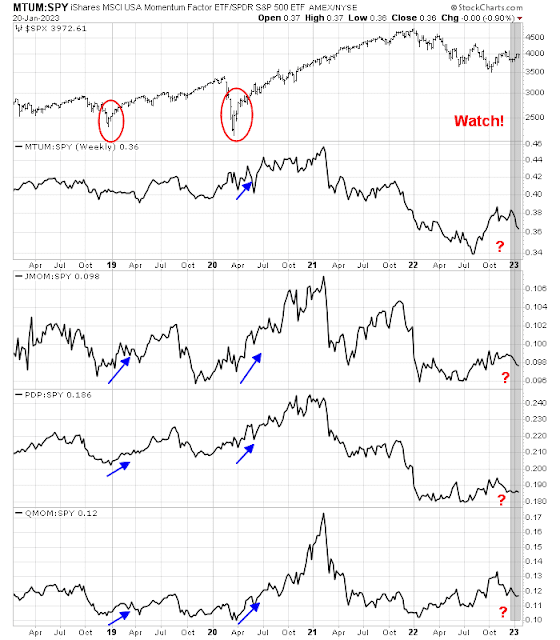
One way of verifying a price momentum signal is to monitor if the price momentum factor is working at the individual stock level. While market-level price momentum (breadth thrusts) can be impressive, the market needs positive follow-through, led at the stock level. Stocks that have been going up need to continue to rise. At the last two major bottoms in late 2018 and in 2020, different versions of the price momentum factor exhibited positive returns. So far, the price momentum factor hasn’t shown much of anything, but arguably it’s still early.
On the other hand, the relative performance of defensive sectors lagged in the recent market rally, which is supportive of the bull case.
An ironic technical outcome of the looming debt ceiling impasse could be short-term equity bullish, notwithstanding the negative effects on market psychology. That’s because the US Treasury is expected to draw down the Treasury General Account (TGA) at the Fed to cope with the debt ceiling breach. A falling TGA injects liquidity into the banking system, which could be supportive of higher stock prices.
Fed liquidity, which is the combination of the effects of Quantitative Tightening, changes in the TGA account, and Reverse Purchase Agreements (blue line), have been correlated to the levels of the S&P 500 (red line).
A short-term sell signal
Last week, I highlighted a tactical sell signal when the correlation between the S&P 500 and VVIX, which is the volatility of the VIX Index, spiked. This is usually an indication that the option market does not believe the short-term advance in stock prices, especially if the market is overbought. The overbought condition is beginning to reverse itself but readings aren’t neutral yet, which could foreshadow some more short-term downside potential, but it tells us little about the intermediate-term trend.
In the short run, a near-term bottom is probably not in sight just yet. The term structure of the VIX is still upward-sloping and there are few signs of fear.
Crucial tests ahead
The next few weeks will represent crucial tests for global risk appetite. The S&P 500 stalled at trend line resistance and support can be found at about 3850, while resistance is at about the current level of 3975. A breakout in either direction could be a useful directional signal for traders. From a fundamental perspective, a substantial number of S&P 500 stocks will report earnings in the next 2-3 weeks and set the tone for equity risk appetite.
As well, the FOMC meeting on February 1 could be a source of volatility. The long Treasury bond ETF (TLT) tested a key resistance level but retreated to 10 dma support. The international sovereign bond ETF (IGOV) staged an upside breakout but pulled back to the breakout turned support level.
Stay tuned. My inner trader is still tactically short the S&P 500. The usual caveats apply to my trading positions.
I would like to add a note about the disclosure of my trading account after discussions with some readers. I disclose the direction of my trading exposure to indicate any potential conflicts. I use leveraged ETFs because the account is a tax-deferred account that does not allow margin trading and my degree of exposure is a relatively small percentage of the account. It emphatically does not represent an endorsement that you should follow my use of these products to trade their own account. Leverage ETFs have a known decay problem that don’t make the suitable for anything other than short-term trading. You have to determine and be responsible for your own risk tolerance and pain thresholds. Your own mileage will and should vary.
Disclosure: Long SPXU


The US Large Cap and Small Cap internal Factor Indexes have finally turned fully bullish to join China and Europe who have been in strong bullish for a couple of months.
This would explain the underperformance of the momentum indexes in the charts above. When we have a TWIST as we did across the board on November 10th, the low momentum populated Vulnerable Index shoots up and keeps on leading. These are the stocks that were weakest in the bear market. Since Momentum Indexes like MTUM own the high momentum stocks, they would lag.
This is all continuing reinforcement of Spring in the Tactical Factor Market Rotation.
I am avoiding US bond and stocks until after the debt ceiling agreement is signed. Back in 2011, stocks and bonds shot up post signing.
Note that this week, leaders of France and Germany say they are VERY confident that their countries will avoid a recession. A few months ago, everyone thought a recession was a sure thing. We are already see a very few American strategists tentatively seeing less dire recession signs. I personally see high yield spreads tightening and acting like a deep recession isn’t in the cards.
Let me point out that in a pre-Presidential Election year like 2023, the market has NEVER been down between January first and July 30 back to WWII. The Fed is a political animal and Powell is a political science graduate.
There is the famous saying “There is always a first time”.
The pig in the python of Covid stimulus, could be playing a role here. We think of those stimulus checks that got into those millions of hot little hands and “oh yeah, that money has been spent”. True, but the money has not been destroyed unless it all went to paying off debt, which I am willing to bet the moon on is not the case. So where did the money go? Well some has gone to emerging markets, somebody else’s bank accounts, all sorts of places. Most of that money is likely still out there wherever that is.
The New York Adline is still in a down trend, is it bottoming? Don’t know, but it could be.
We have not had a pandemic in our lifetimes, unless you are 105 and still investing. We have not had helicopter money before, so we have some firsts to contend with.
Debt forgiveness on college loans is new also, I’m waiting for them to pay off my mortgage lol.
When is the next raft of helicopter money coming?
Since there is a tightness in the labor market, will this support robotics? We have Flippy doing burgers, what’s next?
One thing to keep in mind is that the market and Main Street are not strictly reflective of each other, hence the wealth gap. If robots displace millions of workers may be good for stocks, but not for the average person.
Personally, I am happy to trade short term, but until I have clearer signs that things have turned I am heavy on cash. I am following what some say about leaving the top and bottom 10% to others.
I have the luxury of only answering to myself, not making money on the next rally is not as important as not losing my money.
Speaking of money, we are in a purely Fiat world , look at what has happened since 1971. The politicians are not spending real money so to speak, how this will end, ask Wiley Coyote. My take on it is at some point, those who do real work will want real money. Pressing a computer button and adding another zero on the books is not work. Real things take work, whether it is growing and harvesting food, pumping oil out of the ground, mining copper etc, these are real things. The service industry is largely servicing the transfer of real things….so you go to the Gap for a pair of jeans (real item), you get the service from an attendant (not real work, sorry because nothing was produced, which is why amazon will continue to be busy and take market share away from brick and mortar)
If you create something that others value is productive work. It’s what the emerging markets are doing, so it’s no surprise if in the long run they will do well if we continue along the path our politicians have chosen.
Are Cryptos the poster child for not real?
Is what happened with the ruble the canary in the coal mine? I’m not a fan of Putin, but oil and gas are real. After the initial fall in the ruble, it went up. China, India and others will buy oil where they can get it at the best price, that’s what free markets mean.
At some point the purchasing power of the USD relative to others will go down unless the service part of the economy gives way to the manufacturing part. You don’t get rich by just spending money.
The market is saying ‘mission accomplished’; Fed will likely be more deliberate and nuanced. The ghosts of 1970-1980 inflation saga will influence their thinking and decisions.
I would rather see higher for longer to bring inflation down to 2% than go through a roller coaster. I agree with Bullard’s views.
Agree.
Big cap techs actually could be attractive soon. No recession around the world. USD weakening. Large layoffs. So in this vein indices should move up decisively, and will trigger growth/value rotation. In such a short period time EFA and EEM performance spread again SPY has reached historical level. Expect money to rotate back to US. The short term DeMark indicator has reached 13 exhaustion but NYSI indicates there is some juice left.
SP500 quarterly earnings yoy 2023: 3Q about 4.5%, 4Q about 10%. 1Q and 2Q about a small negative.
2% target mandated by Fed looks more and more like jawboning. The job market will not support this arbitrary number. Financial market will force Fed’s hands.
Cam’s been nailing the ST trades. Might his medium-term outlook play out as well?