Preface: Explaining our market timing models
We maintain several market timing models, each with differing time horizons. The “
Ultimate Market Timing Model” is a long-term market timing model based on the research outlined in our post,
Building the ultimate market timing model. This model tends to generate only a handful of signals each decade.
The
Trend Asset Allocation Model is an asset allocation model that applies trend-following principles based on the inputs of global stock and commodity prices. This model has a shorter time horizon and tends to turn over about 4-6 times a year. The performance and full details of a model portfolio based on the out-of-sample signals of the Trend Model can be found
here.
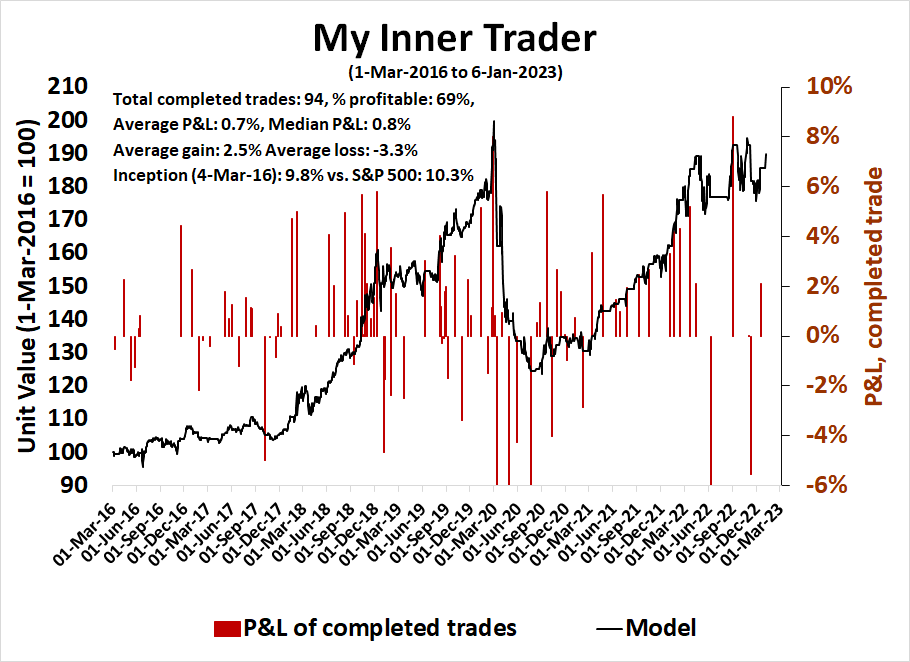
My inner trader uses a
trading model, which is a blend of price momentum (is the Trend Model becoming more bullish, or bearish?) and overbought/oversold extremes (don’t buy if the trend is overbought, and vice versa). Subscribers receive real-time alerts of model changes, and a hypothetical trading record of the email alerts is updated weekly
here. The hypothetical trading record of the trading model of the real-time alerts that began in March 2016 is shown below.
The latest signals of each model are as follows:
- Ultimate market timing model: Sell equities
- Trend Model signal: Neutral
- Trading model: Bullish
Update schedule: I generally update model readings on my site on weekends. I am also on Twitter at @humblestudent and on Mastodon at @humblestudent@toot.community. Subscribers receive real-time alerts of trading model changes, and a hypothetical trading record of those email alerts is shown here.
Subscribers can access the latest signal in real time here.
Waiting for clarity from earnings season
As the New Year dawns on investors, fresh concerns are bubbling up for the US equity outlook. The most immediate is the approaching Q4 earnings season reports, which begins in earnest when the banks report earnings this coming Friday. Already, forward 12-month EPS are rolling over across the board for large, mid, and small-cap stocks. Upcoming corporate guidance will determine the degree of valuation pressure stocks will face in the coming weeks and months.

A top-down macro analysis indicates growing margin pressures. A yawning gap has appeared between corporate profits as a percentage of GDP (blue line) and annual changes in average hourly earnings (red line, inverted scale). While these pressures are long-term, slowing economic growth in 2023 could be the catalyst for a collapse in corporate margins.
For now, margins don’t look like they’re in any imminent danger of a collapse.
FactSet reported that the level of negative guidance for Q4 is elevated, but readings aren’t excessively high.
Earnings season could hold the key to the short-term direction of stock prices. I am not optimistic. As another sign of fundamental weakness, the
WSJ reported that corporate insiders have not been buying despite the market’s recent weakness.
So long, Fed Put
The release of the
December FOMC minutes did equity investors no favors. Fed officials affirmed their resolve to fight inflation
Several participants commented that the medians of participants’ assessments for the appropriate path of the federal funds rate in the summary of economic projections, which tracked notably above market-based measures of policy-rate expectations, underscored the committee’s strong commitment to returning inflation to its two per cent goal
More importantly, it telegraphed that it wants lower asset prices as a way of tightening financial conditions. If financial markets adopt a risk-on tone, the Fed will have to tighten further to counteract the loosening effects.
Participants noted that, because monetary policy worked importantly through financial markets, an unwarranted easing in financial conditions, especially if driven by a misperception by the public of the committee’s reaction function, would complicate the committee’s effort to restore price stability.
Financial conditions have begun to tighten again after loosening, but readings are far from extreme. The Fed has more work to do.
The IMF’s First Deputy Managing Director Gita Gopinath voiced support for the Fed’s tight monetary policy stance in a
FT interview. She said that the Fed was correct to emphasize it would “maintain restrictive monetary policy” until there was a “very definite, durable decline in inflation” that was evident in wages and sectors not related to food or energy. She went on to echo the Fed’s concerns over the resilience of the labor market as a source service sector inflation.
So long, Fed Put.
One final flush?
These conditions are setting up for a final flush in stock prices.
Dean Christians at SentimenTrader observed that the percentage of sub-industry groups with a positive one-year return fell to a low of 17% in 2022, but average bear market bottoms occur at a reading of 12%.
From a technical perspective, watch for the S&P 500 to decline while the NYSE Summation Index to either reach another oversold extreme, or exhibit a positive divergence/
What could go right
Despite the gloomy fundamental and macro outlook for US equities, here are a couple of non-US bullish factors to consider.
First, the market has become very excited about the China reopening trade. Chinese stocks are on a tear and exhibited a V-shaped rebound. Continued positive momentum could see possible spillover effects as the reopening narrative become a global reflation narrative.
Another bullish tail-risk factor is the possibility of the collapse of the Iranian regime as protests continue to simmer. A regime change would be a bullish shock to risk appetite for two reasons. The most direct would be lower oil prices as Iranian supply become more freely available as sanctions ease, which amounts to an indirect tax cut to consumers. As well, Iranian weapons would no longer be available to Russia, which would put greater pressure on Moscow to end the war, which would compress the geopolitical risk premium.
The Economist speculated that, as political pressures build in 2023, it will be the military have to decide whether Iran’s future lie with the ayatollahs or the revolutionary women.
Whoever wins, men with guns will exact a price as guardians of the Islamic or secular revolution. In the uneasy equilibrium between the three pillars of Iranian politics—the clerics, the people and the armed forces—it will be the military men who will have the casting vote on whether Iran’s future lies with the ayatollahs or the revolutionary women.
First, a counter-trend rally
That said, the usually reliable S&P 500 Intermediate-Term Breadth Momentum Oscillator (ITBM) flashed a short-term buy last week, signaling that a possible counter-trend rally is underway. The historical record of this model is remarkable. Of the 24 signals shown in the last five years, 20 resolved bullishly and only four failed. Subscribers received an alert that my inner trader had initiated a long position in the S&P 500 last Thursday.
As with all trading models, it’s useful to have both clear entry and exit signals. The buy signal occurs when the 14-day RSI of ITBM recycles from oversold to neutral. A useful rule for exiting the long trade is either the 14-day RSI becomes overbought, or the percentage of S&P 500 above their 20 dma becomes overbought. Current conditions suggest that while there is profit potential in the short-term trade, the duration of the trade is unlikely to last much more than a few days.
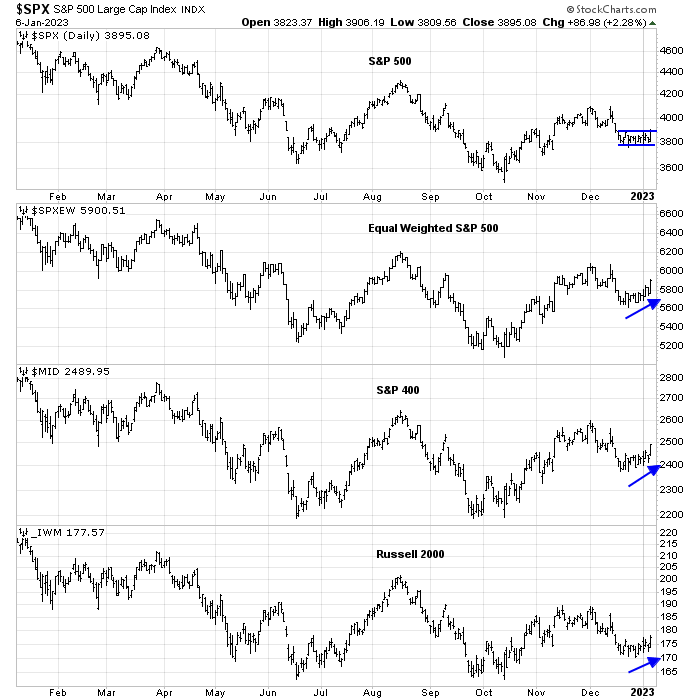
Tactically, the short-term bullish impulse is supported by evidence of positive breadth. Even as the S&P 500 tests the top of its range, the equal-weighted S&P 500, the mid-cap S&P 400, and the small-cap Russell 2000 have all broken out into minor uptrends.
Traders shouldn’t try to overstay their welcome. Investors should take advantage of any strength to lighten up equity positions.
Here are the usual disclaimers about my trading positions:
I would like to add a note about the disclosure of my trading account after discussions with some readers. I disclose the direction of my trading exposure to indicate any potential conflicts. I use leveraged ETFs because the account is a tax-deferred account that does not allow margin trading and my degree of exposure is a relatively small percentage of the account. It emphatically does not represent an endorsement that you should follow my use of these products to trade their own account. Leverage ETFs have a known decay problem that don’t make the suitable for anything other than short-term trading. You have to determine and be responsible for your own risk tolerance and pain thresholds. Your own mileage will and should vary.
Disclosure: Long SPXL


Welcome back, Cam!
The model portfolio is 60/40 and equities decline as conditions warrant.
This year, I am looking forward to and hoping that there would be more coverage of credit portion of the portfolio.
Thanks!!
Iran situation has incredible leverage. It directly impacts situation is Syria, Yemen, and Palestine. And indirectly impacts Russia, and consequently Mexico, Nicaragua, Venezuela, and NK. US border crisis has a large footprint of Russia and China. One step at a time to relieve the problem; Russia first, and then China.
We can also use $nysi RSI14 as trading signals. It is simple and clean and effective.
The forward earnings chart of Europe looks TOTALLY different than America’s. It is shooting dramatically up to new highs. The forward PE is about 12X versus 17X for US. Euro Banks are finally making money now that negative rates are gone. Energy prices are plunging. Governments are issuing massive corporate and citizen subsidies. This is early bull market action not bear market.
China’s forward estimates are coming up and will soar higher as the Covid proves less harmful than feared. Government and Central Bank actions and junk bonds soaring are all early bull market actions not bear market.
Oil and agricultural prices are plunging. Great news as inflation slides down this year. Interest rates are at or near their highs. Why quibble about the last half a percent or less when rates have gone up four percent. The rate rising story is behind us.
Note on Cam’s chart above regarding the short-term positive indicator. If it works like other times, this will be the first higher low and later a higher high. That is new bull market chart action.
December 2024 Fed Funds Futures fell dramatically last week and now are almost 1.5% below the December 2023 reading. Think what that means. In the Presidential election year professional traders see a huge drop in rates. By then inflation will be down, the war over, China Covid a memory.
We have a new global bull market where the US lags badly as their heavily index weighted Tulip Bulb Craze bubble Growth stocks unwind for a second year. Focusing on the S&P Index here will miss the big picture opportunities. (deep US Value will likely almost keep up to international counterparts)
If you diss it, you will miss it.
If the rate rising story is behind us, won’t the US cut rates to juice its market to keep up with the international counterparts?
Another great call, Cam – keep it up!