Mid-week market update: The US markets have surged recently relative to global equity markets, as measured by MSCI All-Country World Index (ACWI). Developed markets (EAFE) and emerging markets (EM) have weakened on a relative basis.

How long can this last? The S&P 500 is testing an important resistance level that could lead to an all-time relative high for US stocks. The renewal of US leadership has coincided with a display of strength of growth over value.
A style bet by another name
This is a style bet by another name. The relative performance of the Russell 1000 Value to Growth ratio has closely tracked the EAFE Value to Growth ratio. From a technical perspective, the move appears exhaustive as the Russell Value to Growth ratio is exhibiting a positive RSI divergence. While relative breadth appears to be weak for value stocks, they are showing signs of bottoming.

Waiting for the cyclicals
One reader (Ken) has suggested that Q2 earnings season may be the catalyst for a value turnaround. There may be reason for optimism for value bulls. Value stocks have a heavy cyclical component, and forward EPS estimates have been rising steadily as we approach earnings season.

FactSet reported a record high in quarterly EPS revisions since it starting keeping records.

First up in the earnings reports are the major banks, which have value characteristics. This will be the first acid test for the market. The bulls will argue that the Fed has allowed the banks to release reserves in order to increase their dividends. The bears will argue that a flattening yield curve is negative for the relative performance of this sector, as banks tend to borrow short and lend long. A flattening yield curve is therefore negative for profitability.

A growth scare
I interpret the flattening yield curve as a sign of a global growth scare. The market is becoming concerned over the rising prevalence of the Delta variant which has the potential of halting the global recovery.
The worries are overblown. Vaccinations have been highly protective against the Delta variant. In the UK, case counts are rising owing to the Delta variant, but hospitalizations are not.

In Israel, which also has a high rate of vaccinations, investors may have been alarmed by the Reuters headline “Israel sees drop in Pfizer vaccine protection against infections”.
Israel reported on Monday a decrease in the effectiveness of the Pfizer/BioNTech COVID-19 vaccine in preventing infections and symptomatic illness but said it remained highly effective in preventing serious illness.
The decline coincided with the spread of the Delta variant and the end of social distancing restrictions in Israel.
The most important detail was buried in the report [emphasis added]
Vaccine effectiveness in preventing both infection and symptomatic disease fell to 64% since June 6, the Health Ministry said. At the same time the vaccine was 93% effective in preventing hospitalizations and serious illness from the coronavirus.
The ministry in its statement did not say what the previous level was or provide any further details. However ministry officials published a report in May that two doses of Pfizer’s vaccine provided more than 95% protection against infection, hospitalization and severe illness.
The growth scare should pass. In the meantime, investors have been piling into growth stocks as the perception that economic growth is becoming scarce. It is an open question as to when the US and growth leadership starts to falter.
Intermediate-term bullish
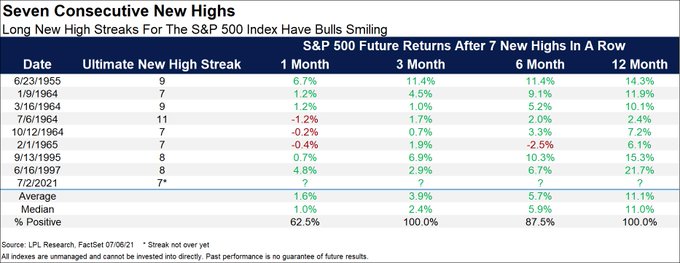
As for the S&P 500, I remain intermediate-term bullish. Ryan Detrick pointed out that the S&P 500 closed at an all-time high last Friday after a seven consecutive day winning streak. Since 1950, this has happened only eight times and the market has trended higher after three months in every instance.
Macro Charts came to a similar conclusion. He found that “Initial drawdowns were minimal [and]
in most cases, stocks extended significantly higher for months (even years)”.

Sure, there have been numerous short-term warnings of negative breadth divergences, but current conditions don’t argue for a massive downdraft in stock prices. Ondra (@overtrader_83) analyzed how the S&P 500 behaved after periods of deteriorating breadth and lagging Russell 2000. The results have been a mixed bag. While the market has resolved itself with corrective episodes, it has also roared higher more often than not.

Andrew Thrasher also observed that less than 2.2% of stocks are down over 20%. Thrasher does not discount the possibility of a “sentiment-driven correction”, but major market declines have not occurred when this metric has fallen to such low extremes.

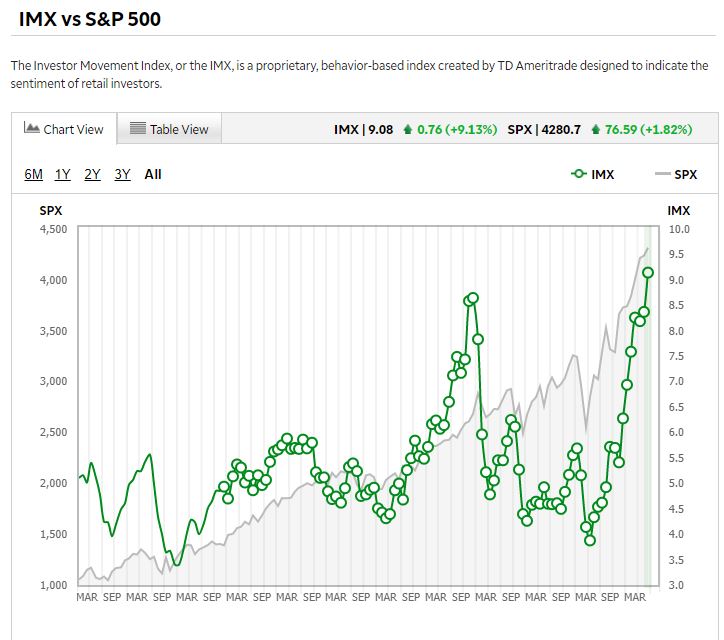
Indeed, sentiment has become a little extreme. The latest release of the TD-Ameritrade Investor Movement Index, which measures the trading sentiment of that firm’s customers, has risen to an all-time high.
Helene Meisler also pointed out that the DSI for both the S&P 500 and NASDAQ are at highly bullish, which is contrarian bearish.
The Daily Sentiment Index (DSI) for Nasdaq and the S&P have both moved to 91. The last time both were over 90 at the same time was late August 2020 as we headed into that peak. As a reminder readings over 90 and under 10 are ones I consider extreme.
In summary, the market is freaking out over a growth slowdown induced by the Delta variant, but those fears are overblown. Investors have reacted by buying growth and US stocks and abandoning the value/cyclical trade but it is unclear how long this trend will persist. In the short term, the market may experience some volatility as sentiment has become a little giddy, but the intermediate-term trend is still bullish.
In an effort to find Value/Growth turning points, I put together my Momentum Twist charts using the extremes of Value/Growth namely Resource Value using XME ETF, U.S. Mines and Metals and Innovative Growth using ARKK ETF Ark Innovation.
I figured there might be a significant standard deviation surge in measured daily volatility at a bottom. Well today there was a Twist. The Standard Deviation was at 2.5% and XME went up 1.8% and ARKK went down 2.3% for a total difference of 4.1%. Here is the chart;
https://product.datastream.com/dscharting/gateway.aspx?guid=eb85cb94-c68a-4aab-a226-31b26c5c1ea7&action=REFRESH
You can see these previous Twists did lead to XME outperformance.
Today’s very strong Twist has me baffled because the other key Resource Value sector, Energy was down and Financials were flat. I will say Materials and Industrials were strong so this could mark a Value low. Supporting that possibility from a contrary aspect is the extreme investor pessimism that has hit Value.
We are all mesmerized by the drop in yields and trying to fit a narrative with the economy for it. But maybe it is just the Fed buying $120 billion a month of bonds when borrowing is low, is the reason, not the economy.
BTW here is the flip side of the Twist chart from the viewpoint of ARKK and Growth.
https://refini.tv/3gOYMoE
The blue Twist lines are when ARKK surges on a given day versus XME. They do proceed strong movement in ARKK shares.
Whether this works for Regular Value and Regular Growth is another story. That needs continuing research. Both factor extremes, ARKK (possible MEME bubble pop) and XME (China suppressing industrial commodities) have dynamics that are effecting them differently than their much tamer factor brothers. So these twists could be misleading or not.
I pass it on for what it’s worth. An idea,
TNX has fallen to 13.2 today. It could be due to growth scare, pension fund buys, short covering by levered hedge funds or a slowing momentum in reopening trade. There is a view that by Q1, 2022 fiscal stimulus would be largely through the system, growth would be again at a lower level. In that scenario, secular growth stocks would be again at a premium valuations.
What if TNX falls to 10? Would the market see a big sell off? Or, growth is stronger than expected and TNX rises towards 20. How would the market react?
The current state is not likely to continue for long, IMO.
In other news, shares of Chinese property developer Evergrande are testing their March 2020 lows.
I think the degree of bifurcation is starting to decrease. Looks like rotation would still happen regularly, but less and less extreme. This makes sense because at this stage of recovery most of the industries already know how to deal with the situations. Very few surprises anymore. So going forward it will be more toward stock picking.
And maybe even shortsellers are going to make money again in the second half of the year. At least those who survived until now.
Being short anything was a dangerous place to be in this market, it started with TSLA in January, then GME and the meme stocks, now bonds. This relentless run against any short positions has led to some serious valuation distortions.
I realize we’re all focused on a bifurcated market, but is it possible that in fact the entire stock market universe is overvalued and in need of a correction? There are many ways to view any chart, but having doubled from the March lows VT seems poised for a significant pullback.
Taking swings at VTV/ FXI/ EEM.
KRE/ XLE/ XLI.
GDX.
PICK.
XLF.
VEU.
COIN.
Not necessarily bullish on the market – feels more like opening positions on fear.
BABA.
EFV.
PAVE.
ASHR.
All positions (with the exception of GDX/ VEU/ BABA) off here. Why? It just seems everyone is panic buying.
Remaining positions off here.
Zero conviction in this bounce beyond where it is now.
Yesterday’s announcement from Pfizer/BioNTech – that a new vaccine targeting the Delta variant already exists – sounds like it has the potential of being the catalyst for a turnaround in the growth/value performance.
TLT/ NIO/ AMZN.
Adding to NIO/ AMZN.
AMZN off.
NIO off.
TLT in static mode. Unless bonds trend higher into the close, I plan to hold my existing position through the weekend.
Always a tough call as to whether to hold positions overnight with markets near ATHs. Had I reopened partial positions yesterday and held overnight, it would have obviously paid off well. On the other hand, NOT having any positions heading into yesterday’s open also paid off well.
https://twitter.com/mardermarket/status/1413609502289453056
That sounds about right.