Preface: Explaining our market timing models
We maintain several market timing models, each with differing time horizons. The “Ultimate Market Timing Model” is a long-term market timing model based on the research outlined in our post, Building the ultimate market timing model. This model tends to generate only a handful of signals each decade.
The Trend Asset Allocation Model is an asset allocation model which applies trend following principles based on the inputs of global stock and commodity price. This model has a shorter time horizon and tends to turn over about 4-6 times a year. In essence, it seeks to answer the question, “Is the trend in the global economy expansion (bullish) or contraction (bearish)?”
My inner trader uses a trading model, which is a blend of price momentum (is the Trend Model becoming more bullish, or bearish?) and overbought/oversold extremes (don’t buy if the trend is overbought, and vice versa). Subscribers receive real-time alerts of model changes, and a hypothetical trading record of the those email alerts are updated weekly here. The hypothetical trading record of the trading model of the real-time alerts that began in March 2016 is shown below.

The latest signals of each model are as follows:
- Ultimate market timing model: Buy equities
- Trend Model signal: Neutral (downgrade)
- Trading model: Bearish
Update schedule: I generally update model readings on my site on weekends and tweet mid-week observations at @humblestudent. Subscribers receive real-time alerts of trading model changes, and a hypothetical trading record of the those email alerts is shown here.
A disappointing January
The month of January turned out to be a disappointing. Stock prices roared ahead out of the gate and pushed major market indices to fresh all-time highs. By the end of the month, the market had retreated to end the month slightly in the red. More importantly, the monthly chart printed a graveyard doji, which is often interpreted as a sign of trend reversal.

Steve Deppe studied past instances when the market rose 3% or more, set a fresh new all-time high, but finished in the red for the month. While the sample size is not high (N=10), the historical results reveal a heightened probability of large drawdowns in February.
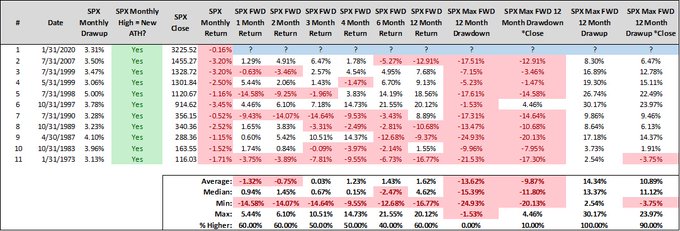
The melt-up hangover may just be beginning.
Bearish trend reversals
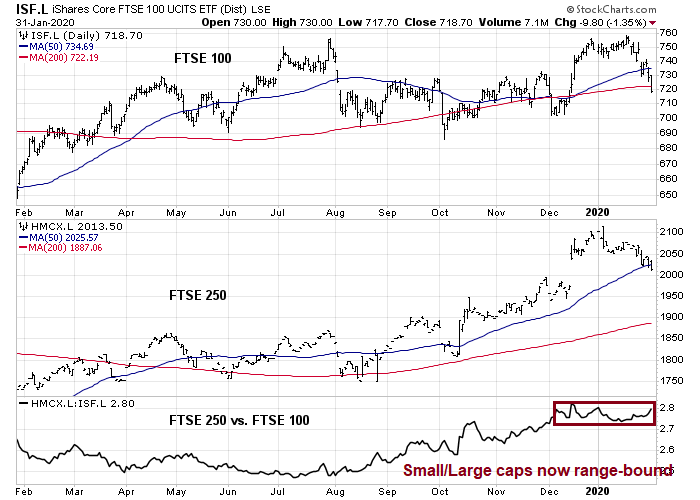
Signs of bearish reversals are found everywhere. The UK officially exited the European Union on Friday. The FTSE 100 managed to fall below both its 50 and 200 day moving averages (dma) last week. More importantly, the small cap to large cap ratio flattened out and it has been range-bound since December, indicating lessening enthusiasm over the prospect of a booming local British economy.
Over on this side of the Atlantic, credit market risk appetite has plunged and flashed a negative divergence warning for the stock market.

The USD Index rallied through a bull flag formation last week. USD strength is a bearish sign for EM assets, because some fragile EM economies have excessive USD debt, and a rising greenback hampers their ability to repay.

Both the copper/gold and platinum/gold ratios, which are key cyclical and risk appetite indicators, are breaking down.

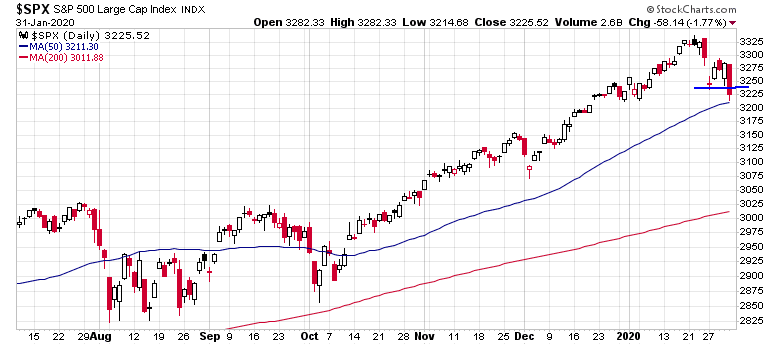
Friday’s stock market action was also disappointing. The index violated the lows of the week, indicating the bears had taken control of the tape.
As a consequence, the signal of the Trend Asset Allocation Model has been downgraded from bullish to neutral.
Silver linings
Nevertheless, the bulls can find some silver linings in a dark cloud. Both fundamental and macro momentum remains positive and constructive.
The latest Q4 earnings season update from FactSet revealed both good news and bad news. The bad news was, despite selected strong headline beats by large cap stocks like AAPL and MSFT, both the EPS and sales beat rates fell from last week, and they are now below their 5-year historical averages. The good news is forward looking indicators, namely the forward 12-month EPS estimate, rose strongly last week.

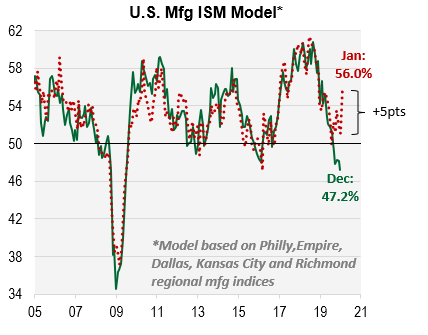
The bulls may find some solace in the ISM Manufacturing print to be scheduled for Monday morning. Aneta Markowska of Cornerstone Macro found that all five Fed regional manufacturing surveys improved in January, which suggests an upside ISM surprise.
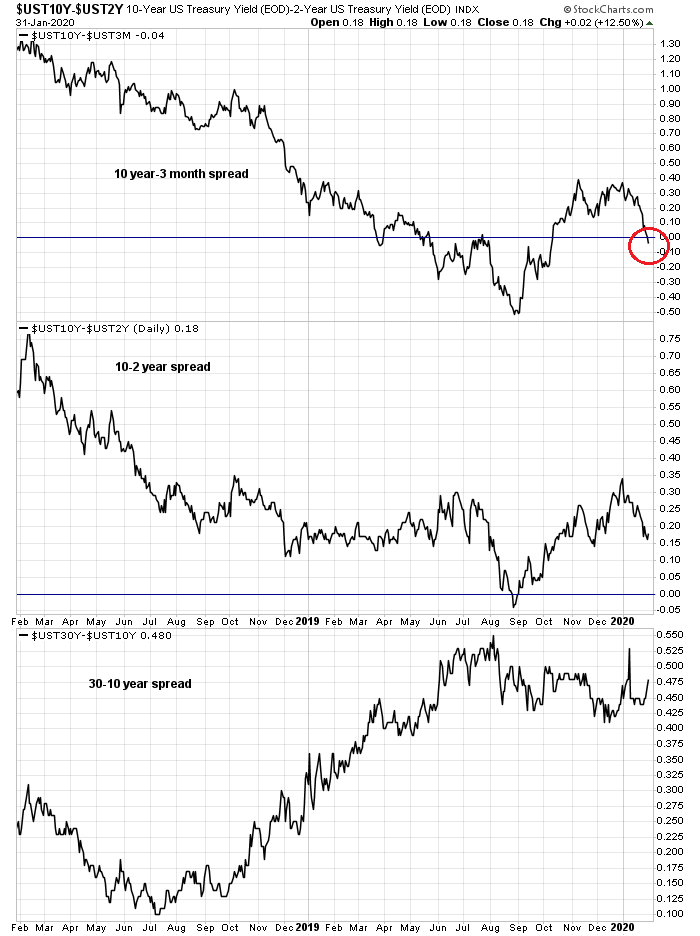
The 3m10y yield curve has inverted, which has caused some consternation among investors. Similarly, the 2s10s has been flattening rather rapidly, which is another sign of slowing growth expectations. However, the 10s30s spread at the long end of the yield curve has steepened, even as the 30-year yield fell below 2%. The long end of the curve is not confirming the flattening and slowing growth thesis.
Rob Hanna at Quantifiable Edges pointed out his Capitulative Breadth Indicator (CBI) had rose to 9 just before Friday’s market close.
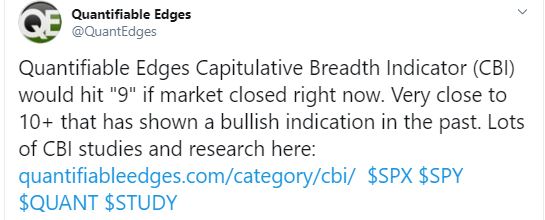
In the past, he had used a CBI reading of 10 or more as a buy signal. However, he conducted a study based on a CBI reading of 9 or more, and the market closed at a 20-day low, and the results were encouraging.

The market may be oversold enough to stage a relief rally next week.
Resolving the bull and bear cases
Here is how I resolve the short-term bull and bear cases. The sell-off can mainly be attributed to excessive bullish positioning, and the news of the coronavirus was only a convenient trigger. The market will not make a durable bottom until sentiment gets washed-out.
We are not there yet. We have not seen the classic signs of capitulation. The Citigroup Panic/Euphoria Model (via Barron’s) remains in euphoria territory.

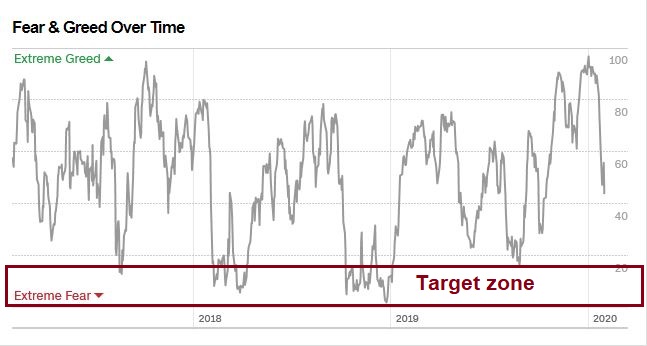
The Fear and Greed Index closed Friday at 44, which is constructive but the reading is still neutral, and it has not reached the sub-20 levels normally seen at market bottoms.
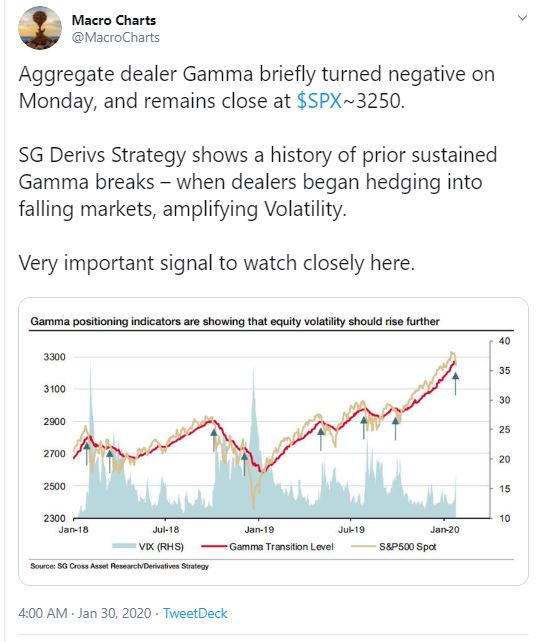
In the short run, much depends on positioning, and how momentum players react to events. Macro Charts recently highlighted the estimated dealer positioning based on gamma hedging (see Kevin Muir’s post as a primer on gamma. To make a long story short, dealers who are short gamma need to sell to hedge, which can create a cascade). Gamma turns negative at about SPX 3250. With the market closing 3225, gamma is modestly negative. but we will need further market weakness of 1-2% to spark a rush for the exits.
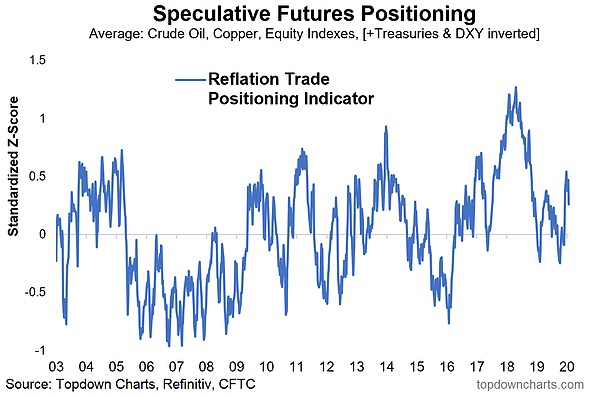
Analysis from Callum Thomas of Topdown Charts shows that the reflation and high beta trade is vulnerable to more de-risking. We have not seen the “margin clerk” price insensitive liquidation phase of the market yet.
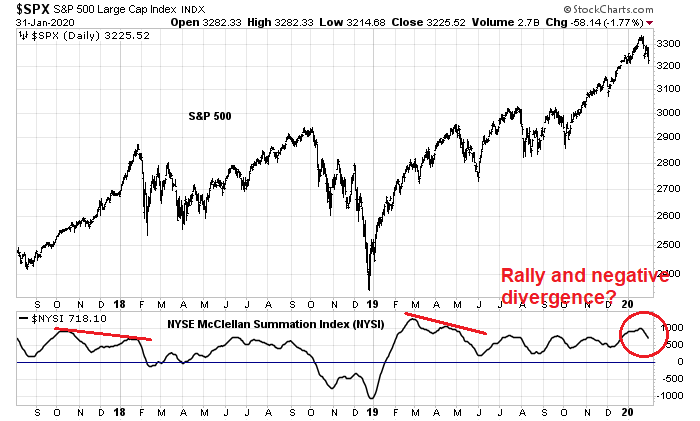
An alternative scenario under consideration is a short-term bounce to test the old highs, accompanied by a negative NYSI divergence. The past two major tops have been characterized by such negative divergences.
If I had to guess, I would assign a 20-30% probability to such an outcome. Mark Hulbert, who also characterized the spark for the current weakness as a retreat in excess bullishness, tried to estimate the size of the correction this way:
Contrarians’ answer is that it depends on how traders react. It would be a good sign if they rush to the sidelines and then quickly jump onto the bearish bandwagon. In contrast, it would be a bad sign if they stubbornly hold onto their bullishness in the wake of the decline. In that case, contrarians would expect that an even deeper correction would be necessary to rebuild the Wall of Worry that would support a new leg upwards.
A short-term rally to test the old highs is paradoxically bad news for the bulls, and would likely resolve in a deeper correction. This “retest the old highs” scenario could very much be in play, and it has the potential to fake out a lot of traders. The market is testing trend line support, and it is just above its 50 dma.
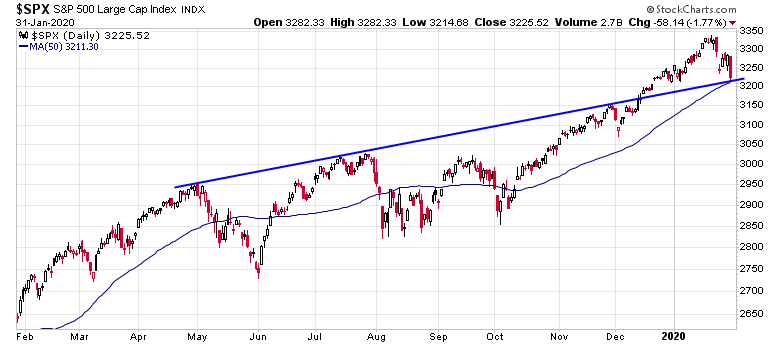
As well, the market is oversold for a bounce, but it does not appear to be oversold enough for a durable bottom.

My inner investor is bullishly positioned, but he will sell any rallies to re-balance his portfolio to an allocation that is closer to his long-term asset mix allocations. My inner trader is short the market, and he plans to short into any rallies next week.
Disclosure: Long SPXU
Here is a chart of Fed Funds futures for end of 2010 and end of 2021. Note how 2020 is down and the 2021 has started to separate lower. This means investors are expecting weakness this year and more in 2021. Are we heading for negative rates?
https://product.datastream.com/dscharting/gateway.aspx?guid=30619ce3-6dc4-460d-b8eb-bdd813ed80b7&action=REFRESH
Potentially there is a third scenario: extended range-bound consolidation, then slow moves up.
Driver: (basically more liquidity)
1. China just injected 1.2T RMB, likely more to come.
2. Fed’s non-QE repo operation and expected rate cuts.
3. This is an election year.
A Seeking Alpha news editor released the following:
‘In a statement, Gilead Sciences (NASDAQ:GILD) Chief Medical Officer Merdad Parsey, M.D., Ph.D., says the company has supplied experimental antiviral remdesivir to a small number of patients infected with 2019-nCoV, the coronavirus causing the current outbreak, on an emergency basis since there are no approved treatments for the respiratory ailment.
‘It is working with Chinese health authorities on a clinical trial to determine the safety and efficacy of the nucleotide analog (it is being developed to treat infections from Ebola and Marburg viruses). It is also expediting laboratory testing of the drug against 2019-nCoV.
‘The New England Journal of Medicine reported that the first U.S. infected person, a man in Seattle, was treated with remdesivir on the seventh day of his hospitalization. Although he is still an in-patient, all symptoms, except his cough (which has improved), have resolved. The day after he received the drug, his temperature dropped from almost 103 degrees Fahrenheit to 99.1, reaching the normal range soon thereafter.’
Separately, the South China Morning Post posted an article about a patient in Thailand treated with a combination of oseltamivir (Tamiflu) + Kaletra (lopiavir/ ritonavir – two protease inhibitors normally used to treat HIV) – the 71-year-old patient subsequently tested negative for coronavirus 48 hours after administration of the cocktail.
If either or both treatments prove effective, it would be a game-changer – and a highly positive catalyst for market prices.
I heard about the combo flu/HIV treatment patient and his recovery. There is also news that China has run out of the tests for the virus and speculation is that possibly 100-350,000 people could be infected now. Does this mean the death rate could be comparable to a flu virus?
Also, they are saying the virus has been found in human feces and that may be helping the spread in China. I guess they are not the most hygienic of peoples. And, I’m encouraged that there are so few cases in other countries at this point.
Senator Cotton is saying the virus originated in the level 4 lab in China that is about 20 miles from the “fish market” where it is first though to have originated. The S&P is up about 12 in overnight trading late Sunday. I think we are in for a wild ride as the rumors fly.
Whether China is underreporting will likely never be known for certain, but as you point out there is actually an incentive to report more cases – it would lower the fatality rate.
Both SARS and H5N1 have been isolated from human stool as well. I think the higher number of cases in China stems almost entirely from the fact that Wuhan is ground zero for the disease, and not a reflection of hygiene (I work in San Francisco, and consider most cities in China to be cleaner).
The Level 4 lab? That’s another rumor that may never be put to rest. In my opinion, the one virus that would strike the most fear should it escape containment is smallpox.
@Cam….what is your inner investor’s long-term asset mix allocations?