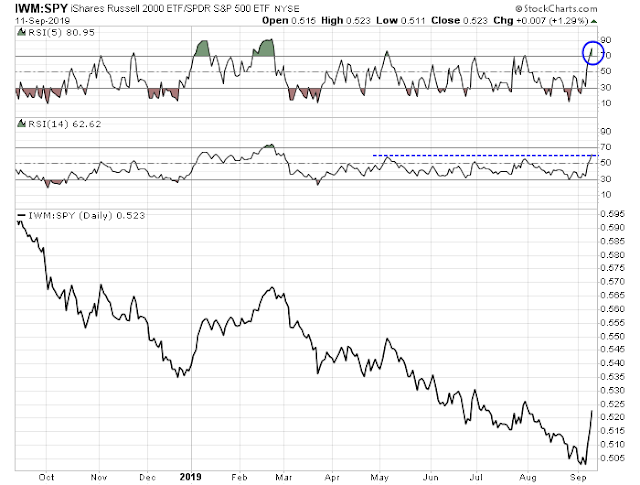
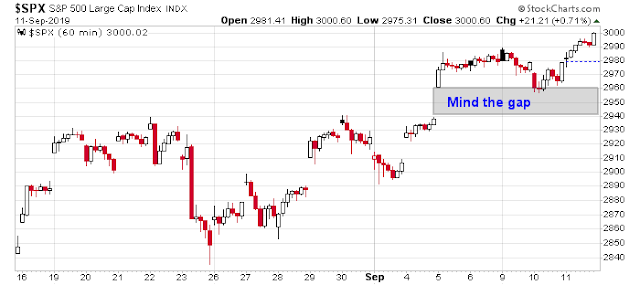
Mid-week market update: Last week’s upside breakout through resistance was impressive. Since then, the market has consolidated above the breakout level, but a FOMO (Fear Of Missing Out) rally has yet to materialize. In the past, such surges have been accompanied by a series of “good overbought” 5-day RSI readings, signs of buying stampedes from TRIN, only to see the rally stall when the 14-day RSI becomes oversold.
Will the upside breakout lead to a FOMO surge? Let us consider the possibilities.
A short-covering rally
So far, the internals suggest that the market strength has mainly been attributable to a short-covering rally, and a FOMO surge has yet to materialize.
The market had gotten into a crowded trade of becoming overly defensively positioned, and overly short the high beta and cyclical groups. While the reversal appeared as if price momentum had cratered, it was also a manifestation of the reversal of a variety of other factors. Gold, which had been in and uptrend, pulled back. Value stocks, which had been in a prolonged period of underperformance against growth stocks, surged. The 10-year Treasury yield reversed itself, and even the shares of long suffering Deutsche Bank rallied. These factors were all correlated, and it can be best described as a short-covering reversal.
While it is impossible to know how long this short-covering reversal will last as much depends on the behavior of the animal spirits, a number of clues reveal that it may be exhausting itself. As the above chart shows, the momentum factor is already strongly oversold on both 5 and 14 day RSI (top panel).
In addition, I had pointed out that the USD Index had reached an inverse head and shoulders target, and it had paused and started to form a bull flag continuation pattern (see Should you buy the breakout?). Similarly, the EURUSD exchange rate had broke down from a head and shoulders pattern, reached target, and began to bear flag. Both broke out of their respective bull and bear flags on Tuesday. As a reminder, excessive greenback strength exacerbate global trade tensions, raises funding risk for weak EM economies, and creates earnings headwinds for large cap US multi-nationals operating overseas. It was USD that was partly attributable to the general defensive positioning of the market, before last week’s reversal and upside breakout.
As well, a number of the factors that reversed themselves are nearing overbought or oversold levels, which could signal a pause or reversal. The Russell 1000 Value to Russell 1000 Growth is one such example of an overbought condition.
The 7-10 Year Treasury Bond ETF (IEF) is oversold on the 5-day RSI, and it is reaching levels on the 14-day RSI where declines have been arrested in the recent past.
Similarly, the small to large cap ratio is some ways a mirror image of the IEF chart. The ratio also overbought on 5-day RSI, and the 14-day RSI is nearing levels when rallies have stalled in the recent past.
What about the FOMO rally?
What does this mean for market direction? Can the short-covering bulls pass the baton to the FOMO bulls to spark a surge to new highs?
An analysis of the market internals reveals a neutral to bearish picture. The chart below shows the relative performance of the top five sectors by weight, and they comprise nearly 70% of index weight. The market cannot meaningfully move up or down without significant participation from these five sectors. As the chart shows, the three sectors (technology, healthcare, and consumer discretionary) are in relative downtrends (44.8% weight), and the other two (financials and communication services) are in relative uptrends (23.2% weight). In short, heavyweight sector relative performance tilted bearish.
Even the news that China had announced tariff exemptions on a number of products as a goodwill gesture did not move the needle In the overnight ES futures market, Here is the report from Chinese state media Global Times:
China on Wednesday announced a plan for certain US imports and companies to file for exemptions from Chinese tariffs, in a goodwill gesture that will help ease the impact of the trade war on US companies and inject fresh optimism into a new round of trade negotiations planned for October.
The US products exempted from Chinese tariffs include 16 types of products highly related to livelihood such as lubricating oil, medical linear accelerators and anticancer drugs. The State Council, China’s cabinet, will continue to work on the exemption list and will publish it “at a proper time.”
Certain imports including lubricating oil, fish meal, parva, medical linear accelerators, anticancer drugs and medicago will be exempted from retaliatory tariffs imposed on US imports from September 17, 2019 until September 16, 2020. Companies involved in the exports of products already subject to tariffs can apply for refunds from Chinese customs within six months, starting from Wednesday.
For imports such as whey and release agents, companies will no longer be subject to retaliatory tariffs imposed on US imports from September 17, 2019 until September 16, 2020. But they will not receive refunds on paid tariffs.
In fact, the announcement was met with a contemptuous tweet from Trump. The trade talks are going well, I can see.
In conclusion, the weight of the evidence suggests that the price momentum factor reversal is nearly over, and it is unlikely to spark a FOMO rally. The market is likely to consolidate sideways, until the bull and bear tug-of-war resolves itself.
My inner trader is in cash, but he is leaning slightly bearish because of the chart pattern of the USD Index indicating it is poised for another rally, as well as the signs that many of the factor reversals are nearing exhaustion. However, he is not prepared to take action until the market either rips higher and becomes overbought, or the SPX starts to fill the gap at 2940-2960.


Thanks Cam for the excellent analysis of the market internals.
I am curious as to why you think the USD rallies here; you have been saying this in several of your recent posts.
Wouldn’t a $ rally be bearish for risk assets (stocks, gold, oil etc.)?
Wouldn’t one expect a $ rally without treasury sell off (higher yields)?
You are correct. A dollar rally would be negative for risk assets. It should be bearish for gold, but gold and USD had recently been moving together.
As I pointed out, bond prices look oversold, and therefore yields look like they are ready to reverse downwards. Therefore that should be USD bullish.
It’s all part of the same correlated trade. It’s just the USD chart looks the most ready for a reversal (compared to other factors like value/growth, yield, etc. which look less ready).
Thanks. So, the sell off in the bond market at some point may be a catalyst for stronger USD.
I appreciate the decisiveness of your position. You won’t always be right but you have made a clear prediction which is a lot better than the “maybe this but maybe that” blather that passes for market analysis in other places!
Cam appreciate the analysis. It is interesting to note that a lot of investors still do believe this rally if we look at sentiment indicators – the AAII survey and put/call ratio but yet the breadth indicators support the breakout based on % of stocks above the 200 MA rising, summation index and advancing vs declining stock %’s based on volume as well.
Sorry meant to say most investors don’t believe this rally.
There are many contrarian indictor that say this rally is not trusted, chief amongst them Joe six pack is still buying bonds and selling stocks. Joe six pack will be buying stocks one day and that would be one indicator to sell.
I notice that Jim Cramer came out yesterday with another SPX Short-Term Oscillator overbought signal (+8). Whether or not you like his personality, the guy is deeply immersed in the daily action of the capital markets and when he takes the time to underscore a point – I always pay attention.