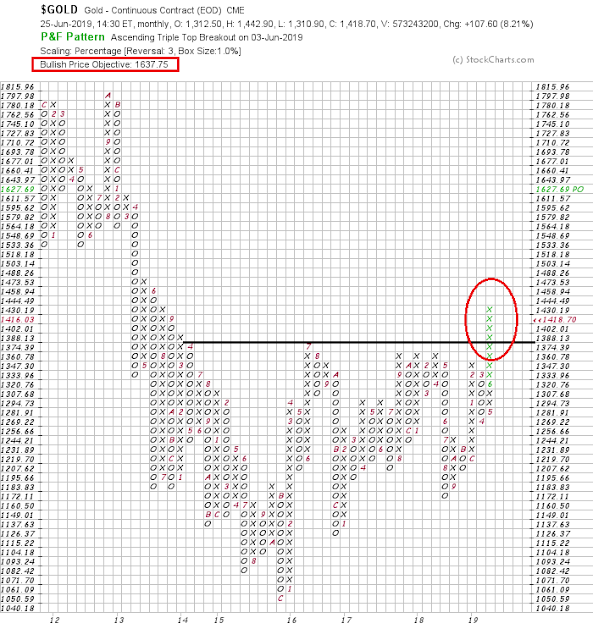
Mid-week market update: Gold staged an upside breakout from a multi-year base, which got a lot of technicians excited. The point and figure chart upside targets range from about 1630 to the mid-1700s, depending on how the parameters are set.
Before you pile in and buy, let me educate you on the causes of this move, so that you can make a reasoned decision. Think of this as the case of a dog and his tail. Gold is the tail, and it is wagging very rapidly. Figure out why before taking action.
What inflation?
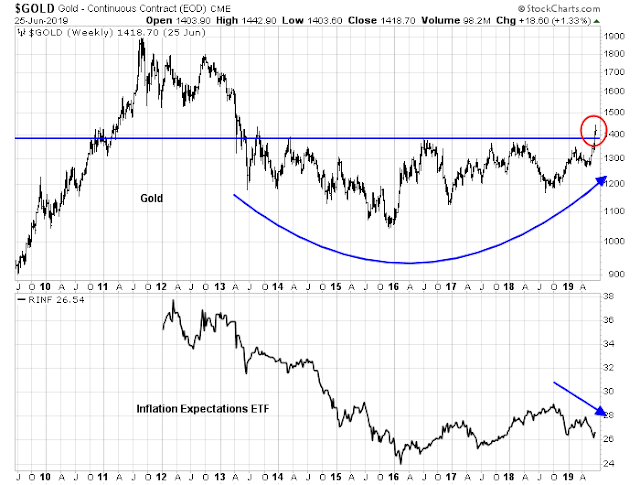
Gold bugs have pointed to gold as an inflation hedge, but this chart showing gold prices and inflationary expectations disprove that theory. Even as gold prices rose, inflationary expectations have been falling.
Don’t buy gold if you are using it as an inflation hedge.
A weak USD
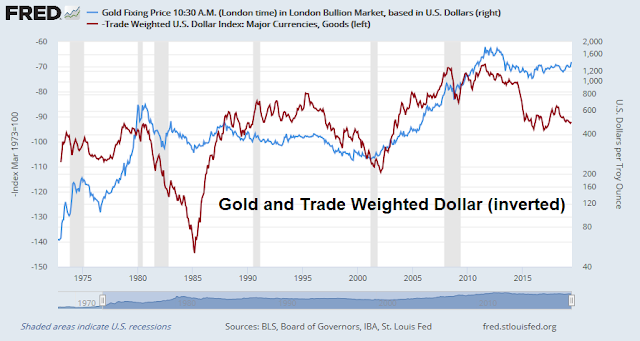
One of the drivers of strong gold prices is a weak US Dollar. Historically, gold has seen a rough inverse correlation with the trade weighted dollar (inverted on chart).
That’s where the Fed comes in. When the market started to discount three rate cuts in 2019, and the Fed did nothing to correct that perception at its June FOMC meeting, the greenback weakened and gold soared.
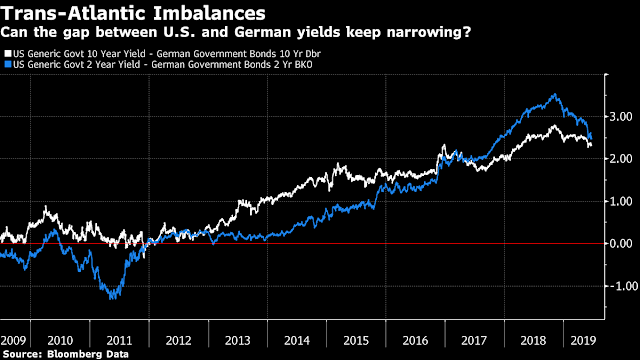
Even though the US 10-year yield hovers around 2%, its spread against Bunds is historically high. Should the Fed embark on a rate cut cycle, there is lots of room for the spread to fall, and for the USD to weaken against EUR. A similar condition holds true for the USD against most other major currencies.
Gold bulls and dollar bears beware! Recent Fedspeak has tempered the market’s aggressive rate cut expectations. Powell’s speech on Tuesday was less equivocal as he made the “on one hand” and “on the other hand” cases:
The question my colleagues and I are grappling with is whether these uncertainties will continue to weigh on the outlook and thus call for additional policy accommodation. Many FOMC participants judge that the case for somewhat more accommodative policy has strengthened. But we are also mindful that monetary policy should not overreact to any individual data point or short-term swing in sentiment. Doing so would risk adding even more uncertainty to the outlook. We will closely monitor the implications of incoming information for the economic outlook and will act as appropriate to sustain the expansion.
St. Louis Fed President James Bullard is one of the most dovish voting members of the FOMC. He broke with the consensus and dissented at the most recent June meeting by calling for a rate cut. He appeared to moderate some of his dovish position in a Bloomberg interview when he stated that he believed a 50 basis point cut would be overdone, and a 25 basis point insurance cut would be more appropriate.
Maybe a July rate cut is not a certainty after all.
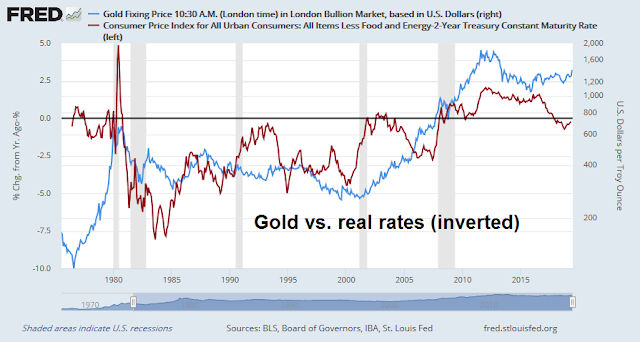
Gold loves falling real rates
Another bullish driver of gold prices is falling real rates. The following chart shows the price of gold with the inverse of real rates.
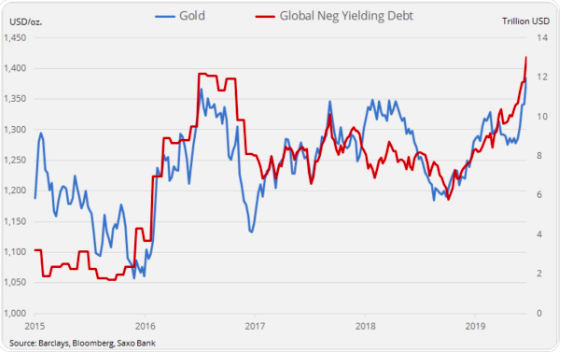
Indeed, as global central banks have pushed bond yields into negative territory, their actions have put upward pressure on gold prices.
Needless to say, Fed policy and falling real rates are inter-related. It is interesting that a minor divide has opened up between senior members of the Fed and the more dovish regional Fed presidents. Fed chair Powell and vice chair Clarida have focused mainly on trade and global growth uncertainties as the reasoning behind a possible insurance rate cut. By contrast, the more dovish regional presidents like Bullard and Kashkari have put far more emphasis on the disappointing realized inflation and falling inflationary expectations to justify rate cuts. Just as revealing was Powell’s hint that the dovish dot plot was attributable to the non-voters, namely the regional presidents, on the FOMC, rather than the Fed governors, who are permanent voters.
Will the global viewpoint of the governors prevail, or will the domestic concerns of the regional presidents gain the upper hand? Should the latter group dominate the discussion, it will mean that the Fed will be focusing on the evolution of real interest rates, which is a key driver of gold prices.
In the short term, gold is wildly overbought. The DSI stands at 93, which is a level that has not been seen since the 2011 peak. Now is not the time to be buying.
Even if you are bullish, be well advised to wait for the pullback, and watch how the other factors and drivers are evolving. Know why you are buying before making the decision.
What about the stock market?
As for the stock market, there isn’t much to say, other than it is marking time ahead of the Trump-Xi summit at the G-20 this weekend. I continue to be concerned that sentiment is a little too relaxed ahead of the meeting, which has the potential to be a high volatility inducing event.
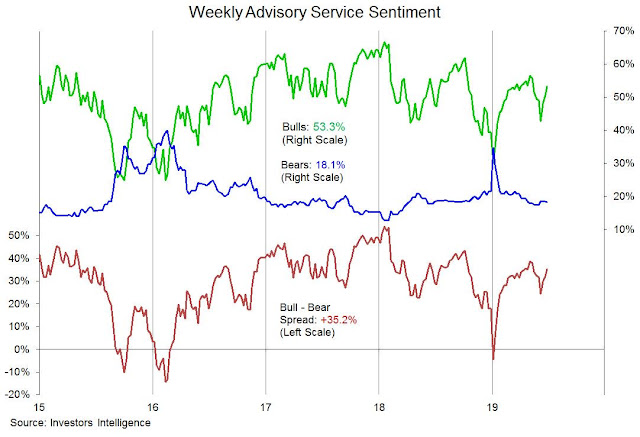
Sentiment surveys, such as II sentiment, has normalized as % Bulls are recovering to pre-pullback levels.
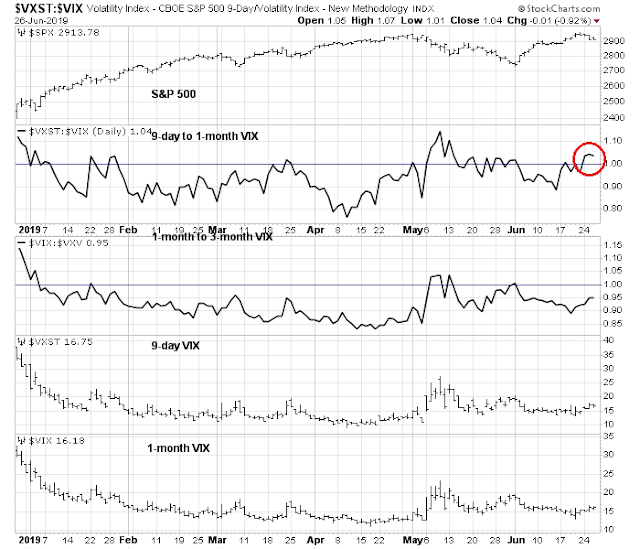
Short-term option sentiment is exhibiting minor levels of anxiety. 9-day VIX (VXST) has spiked above 1-month VIX. Since the G-20 meeting is within the VXST window, this development is entirely to be expected, though I would have thought that the degree of term structure inversion would have been more pronounced.
My inner trader continues to stand aside in cash. He doesn’t need to roll the dice ahead of an event that he doesn’t have a trading edge.
Personal note: Publications will be lighter than usual in the next couple of weeks as I am still recovering from cataract surgery, which makes seeing the computer screen somewhat of a challenge. I will continue to publish a weekend and mid-week update, and the regular service will resume as soon as possible.
Hi Cam, thanks for the note and good luck with your recovery from surgery.
Hugues
Thanks for the insight on the gold breakout Cam. Interesting that bitcoin is also on a year. Do you think similar forces are driving the two rallies?
Wishing you a quick recovery!
Meant to say on a tear…
Momentum-style investing works because it puts you on the right side of the future even when you have no clue as to why a trend is happening.
When a new trend in a given sector starts, it’s best to question whether it could be a big long term trend or something less significant. If one comes to the conclusion that it might be a significant long term trend, the trick is to buy into it. Because of the ‘anchoring bias’ humans will be reluctant to pay more for something that has gone up a lot recently. This is why trends persist. It’s easy to sell something that’s up and hard to buy so it takes longer to get to its real value. That means one should overcome this bias and buy if you have any inkling that we are starting something big.
It the price of gold bullion high today. Yes from where it was at the bottom in 2018 at $1200 but it was at the current $1400 in 2016 and the beginning of 2018. Anchoring just looks at the recent past.
Can gold be a huge winner? Who knows but I will say that all our historic co-relations to other economic factors don’t include a global trade war, an anti-globalization movement, negative interest rates, Trump weaponizing the U.S. dollar-based financial system, American trillion dollar deficits when their economy is strong, the Fed under attack as an independent, non-political body, global financial agencies (WTO, World Bank, etc) undermined, America entering a financial Cold War to stunt the growth of China. Did I leave out anything?
So, as you a imagine, I do believe this can be the early stages of a major long term uptrend.
Nobody has any idea. Let’s see if it can take out 2011 high. You might be right. The whole world is going thru re-adjustment. So as usual, observe and assess and adjust.
Take it easy, Cam.
Thanks for the article Cam. Wish you a speedy recovery.