Mid-week market update: This market is becoming increasingly jittery. Indeed, the chart below shows that the stock market moves more per dollar traded than usual, indicating a lack of liquidity.

This indicates that volatility is likely going to increase. Such an environment can be both profitable and trying for traders, as I have both good news and bad news from the sentiment front.
Long-term complacency = More downside risk
Let us start with the bad news. My former Merrill Lynch colleague Fred Meissner of The FRED Report is finding signs of long-term complacency in the Investors Intelligence data, and readings are similar to levels observed before the Crash of 1987.
The Investor’s Intelligence poll has three categories: Bulls, Bears, and those expecting a correction. We only chart the Bears, and this is why. Managers that are bulls are invested, and managers that are expecting a healthy correction generally remain invested. Managers that are bears are the only ones that really sell, and we assume that they have already sold – in other words, a low %Bears number is ammo for a decline. What normally happens, as markets decline, is that the % Bears number advances. We can see this in the 2010 to 2012 correction, the 2015 to 2016 correction, also in the 1990’s and in the 1970’s. Our concern is that this is not happening during this current corrective phase. One of the most significant times we saw this is during the 1986 to 1988 period, specifically during the 1987 crash period.
Low II %Bears readings indicate complacency:
The takeaway is that low %Bears very often leads to violent declines, especially if the %Bears does not increase as the market is correcting. In addition, it is not low %bears in a vacuum. If the market is rallying and the %bears are low, it is a condition to be monitored but not necessarily a reason to sell. It is how the %Bears react in periods of consolidation and/or correction that is most important.
However, he is not calling for a 1987 style crash (chart annotations are mine).
This does NOT mean we are entering another 1987-like period, but it does mean advisors should be on their guard and know what defensive steps they want to take in a more protracted decline.

I agree. II sentiment is not consistent with levels seen at long-term market bottoms. In light of the technical breakdowns that I have pointed out before, this suggests further downside risk for stock prices.
Short-term washout
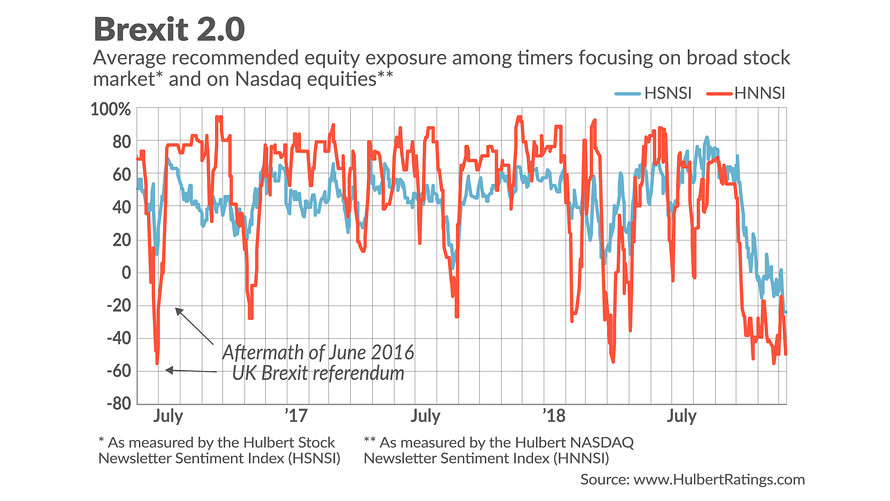
On the other hand, Mark Hulbert recently wrote that his sentiment indicators are at washed-out extremes. Both his market timers (blue line) and NASDAQ timers (red line) indices are at levels not seen since Brexit. This sentiment extreme indicating a crowded short is setting the potential for a market rally. However, Hulbert has noted in the past that his sentiment models are most effective at predicting returns only on a one-month horizon.
Smart money vs. retail money
For a different perspective on sentiment, I am indebted to one of my readers for the (sort of) good news. He has dissected the put/call option activity between the smart money and the retail money. The “smart” money is defined as the index put/call ratio, because the pros tend to dominate activity in index options. By contrast, retail investors dominate individual stock option activity, and their sentiment is better measured by the equity-only put/call ratio.
As the chart below shows, we would prefer to be buying when both the “smart” money and retail money indicators agree with each other, which is defined as a low index put/call ratio (red line, bottom panel) and a high equity-only put/call ratio (blue line, bottom panel). The two indicators are combined in the top panel as the equity put/call – index put/call (blue line, top panel).
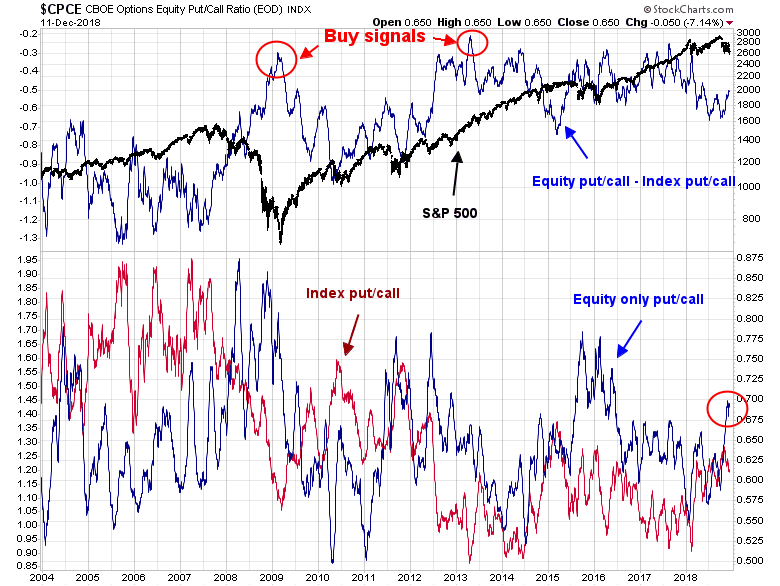
What are the indicators saying now? Retail investors are highly fearful, as measured by the spike in the equity-only put/call ratio. By contrast, the pros are skeptical that the bull case, as their hedging is manifested in an elevated index put/call ratio. This combination is not immediately bearish, as the spike in the equity-only put/call ratio can be supportive of a short-term rally, but the high index put/call ratio suggests any market strength is probably not sustainable.
Here is the big picture. Expect a rally, but don’t expect it too last very long.
My inner investor remains cautious on the stock market. My inner trader covered his short positions last Friday and flipped to the long side in anticipation of profiting from an oversold rally.
Disclosure: Long SPXL
I saw the market calming a little today and a higher low and higher high on the 10 minute chart. If this continues we should have a nice little, and I do mean little, santa claus rally.
Perhaps Grump will offer Ms. Huawei a job in his administration to ease Chinese/American trade tensions? What a coup that would be. The markets would rise 20% in a few days. rdmill
Sorry my finger slipped–or was it my unconscious? Change Grump to Trump! rdmill
Robert,
Grump might have been right! =) Your subconscious is smarter and knows what you were thinking. Thanks for the laugh.
Good post Cam…
No question that retail and dumb money sentiment is dour at the moment. The problem is that in a bear market the sentiment extremes can get much more extreme than what we have been used to during the bull market that has just ended.
Most of my dumb money sentiment indicators reached their extreme oversold readings on 10/29, and since then we have basically chopped around in a sideways range for the last month and a half. Meaning those oversold extremes are being worked off through sideways consolidation and many are approaching neutral readings now. Makes me wonder if the next big leg down is not that far away… could the Santa Rally that everyone expects be the hook that traps short-term bulls?
Time will tell, but any rally here would be a gift for shorts IMHO.
From @ukarlewitz 2days ago: “Hulbert: broad stock market sentiment is in the bottom 98th percentile: traders aggressively betting on a further decline.”
Friday’s action looked like Santa got clubbed on his way to the rally and his transport Rudolph got taken out at the knees. This is actually a typical outcome when a seasonal rally comes up against the looming Death Cross (Dow) as we have seen similar outcomes in late 2015. Funnily, my short term oversold breadth indicator just flashed a buy signal today as it did back in 11/23/18 and 10/29/18, so perhaps we’ll get a few days of relief rally next week. And who knows, if we do get a significant (>1.7%) rally, we may also get an IBD follow through day.