Mid-week market update: There are a number of signs that the pullback that began in late August has run its course. These conditions makes me short-term bullish, but I remain longer term cautious on equities.
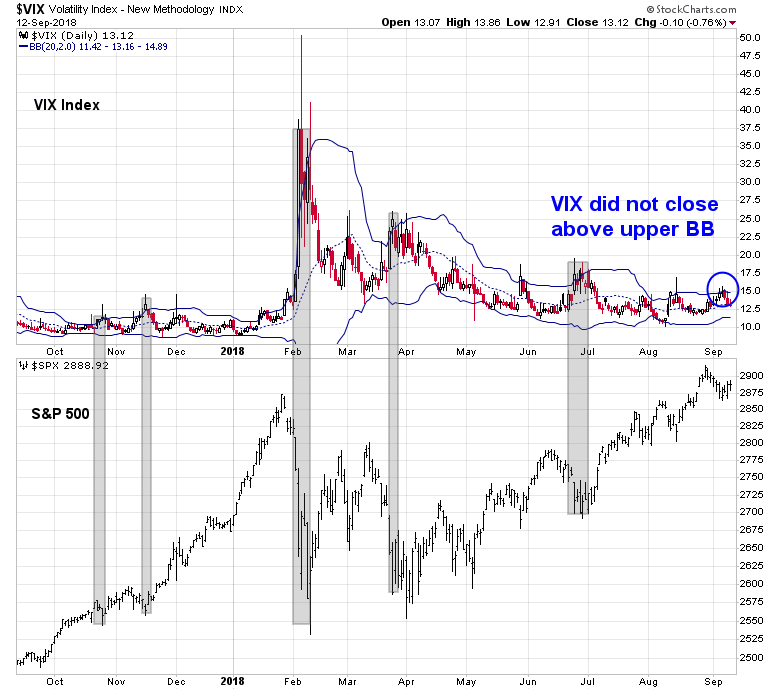
The market’s recent action of a correction to test its breakout level turned support is constructive. The index pulled back to form a bull flag, which is a bullish continuation pattern. It staged an upside breakout out of the flag this week, which suggests that the index may be poised for a test of its previous highs.

Imperfect buy signals
The market also flashed a number of imperfect buy signals, where various indicators neared buy signal levels, but never quite got there. As an example, the VIX Index breached its upper Bollinger Band on an intra-day basis, which would be an oversold condition for the stock market, but never closed there. Nevertheless, the market began to advance after that near-oversold condition.
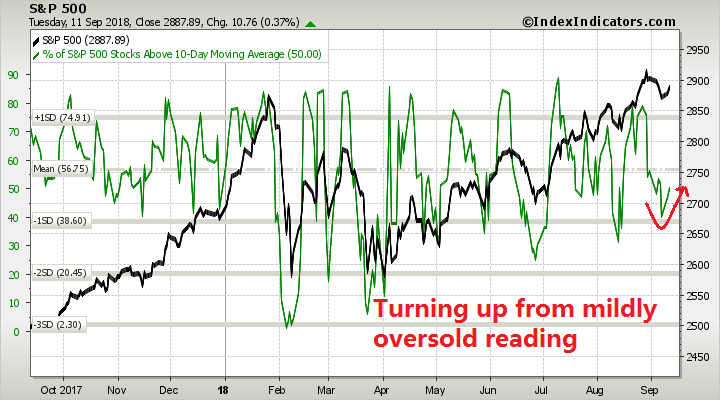
Short-term breadth indicators from Index Indicators tell a similar story. The % of stocks above a 10 dma neared an oversold reading and began to mean revert and turn up.
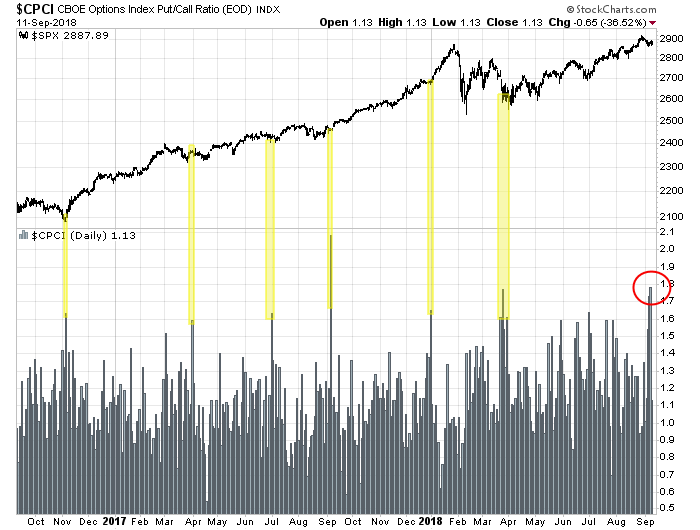
Selected sentiment indicators flashed oversold buy signals. The CBOE Index Put/Call ratio reached an extreme level indicating fear late last week. Past episodes have seen limited downside equity risk.
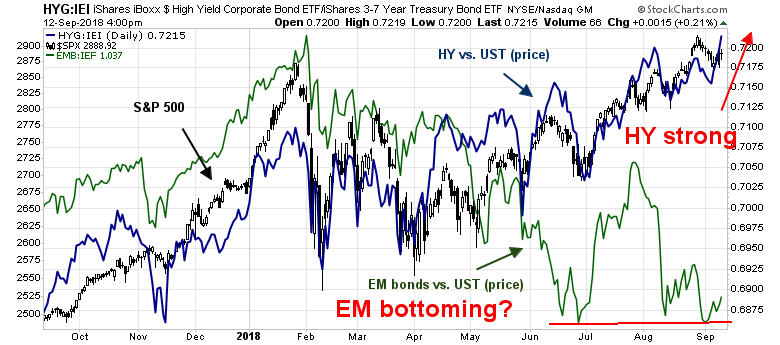
Credit market risk appetite is also supportive of a risk-on tilt. Not only is US high yield leading the market upward, emerging market debt seems to be finding a bottom and have begun to turn up as well.
The combination of these conditions has turned my inner trader bullish.
Long-term cautious
Despite the appearance of these short-term bullish signals, my inner investor remains uneasy. One key question is how long the US market can decouple from the rest of the world. Even as the major US equity indices are within striking distance of their all-time highs, all of the major European and Asian stock market indices have retreated below their 50 and 200 day moving averages.
The chart below illustrates my inner investor’s dilemma. The monthly MACD on the Dow Jones Global Index (DJW) recently flashed a sell signal. Past buy (blue) and sell (red) signals in the last 20 years have marked effective entry and exit points. Moreover, the S&P 500 has tracked DJW closely. This time, however, the S&P 500 has diverged from DJW and surged. Will the divergence end with US weakness, or a rally from the rest of the world?

Other breadth indicators are flashing cautionary signals. My former Merrill Lynch colleague Fred Meissner of The FRED Report recently expressed concerns over the new high-new low indicator this way:
The indicator that most concerns us is the New Highs/New Lows indicator, which has seen two out of the last four weeks with more new lows than highs. This is unusual at new highs in the market, unless those highs are reversed. This is a concern for the same reason we like this indicator. We believe this indicator is the best institutional “footprint” of what the big mutual funds are doing.
Many of these funds have to remain invested in stocks even if they see a bear market coming. What they do then is to sell “junk” and buy “quality”. If you define
junk as stocks near lows that are not prominent in the big indexes, one can see that an expansion of new lows indicates selling by these funds. This, then, is the reason for our concerns – although the indicator itself is still flat to up.

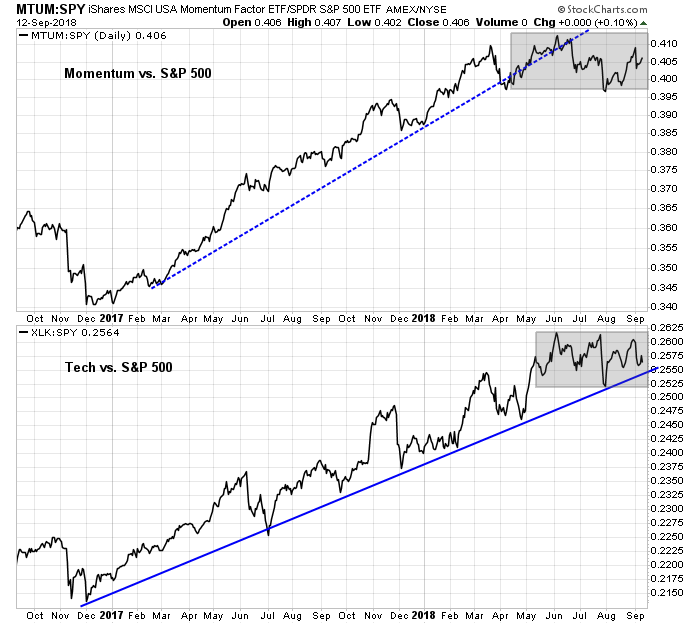
Another way of expressing Fred Meissner’s thesis of “buying quality and selling junk” is price momentum. As the chart below shows, price momentum has breached a relative uptrend line and the performance of the factor has been consolidating sideways. At the same time, I had identified Tech as one of the key leaders in the market’s advance (see Tech as the canary in the coalmine). The relative performance of Tech stocks remain in an uptrend, but it has also been consolidating sideways in the same time frame as price momentum. Unless momentum can decisively stage an upside breakout from its relative trading range, the bulls will face significant obstacles.
Further, the Citi Panic/Euphoria Model is at an exuberant level. Going back to 1987, such readings have seen the market retreat over the following 12-months about 70% of the time.

How you navigate these cross-currents is a matter of time horizon. My inner investors remains cautious, and he is lightening up his equity positions on market strength.
My inner trader believes that a Last Hurrah scenario is in play, where the market is poised to rally and test or possibly exceed the recent highs. Subscribers received an email alert this morning indicating that my trading account had covered all short positions and gone long the market.
Disclosure: Long SPXL
Cam, is there a “follow along” link for The indicator the New Highs/New Lows indicator – the best institutional “footprint” watcher?
— a link that if we save it will update to the current data when we open the link?
Try this link: http://schrts.co/SAqqFS
It worked – Thanks.
Well, I just noticed that,
When I pasted the link into the address bar and hit enter that the address changes to be,
https://stockcharts.com/h-sc/ui?s=%24SPX&p=D&yr=2&mn=0&dy=0&id=p33531802891
So, we’ll see over time if it is link that will update.
You have to click the permalink button below the chart and select reload with a link that works and then save the URL. Then you will be saving Cam’s link, and not the useless link. Why do they change it to a useless link after the page loads? I don’t know.