Mid-week market update: You can tell a lot about the short-term character of a market by the way it reacts to news. When the news of Gary Cohn’s resignation hit the tape after the close on Tuesday, ES futures cratered down over -1%. By the market closed Wednesday, SPX had traced out a bullish reversal after an early morning selloff and closed flat on the day.

Is that all the bears can do?
Signs of washout
The signs of a sentiment washout are showing up everywhere. The TD-Ameritrade Investor Movement Index (IMX) retreated dramatically in February to levels seen last spring, indicating retail investor capitulation.

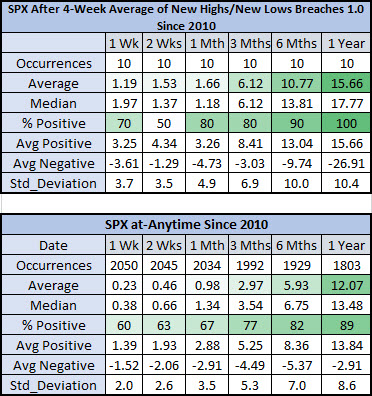
In addition, Schaeffer’s Research found that the first time since the 4-week moving average of new highs/lows fall below 1.0 tends to be bullish.

Though the sample size is not large (N=10) and the study window is relatively narrow (from 2010), past episodes have tended to resolve themselves bullishly.
Despite the negative trade tension headlines, measures of risk appetite are still healthy, which is conducive to further equity price advances.

Putting it all together, none of this tells us much about how the market may react tomorrow or the day after. However, the intermediate term outlook favors a scenario where stock prices are move higher test the January highs in the coming weeks.
My inner trader remains bullishly positioned in anticipation of higher prices. He has some dry powder left so that if prices were to weaken, he is prepared to buy the dip.
Disclosure: Long SPXL
For traders, the current market action is heaven. In the futures market, every one point change in the ES (= S&P futures) is 50$ gain and loss. Last night the ES dipped to 2680, today, it closed at 2720, give or take. That is a swing of 40 points or 2000$ for one contract on ES.
Futures market action however does not always reflect prices on the cash market one on one. As an example, Dow futures last night circa 5-7 pm EST dipped to 400 points. Cash market at the worst, today, was no where close to -400 (one point change in Dow 30 futures, YM is 5$).
While we may have a tradable short term bottom here, and one may be able to generate good profits based on TQQQ and SPXL trades (yesterday TQQQ circa 166 was good entry). I am not sure if there has been enough pain in the market so far. Let us mark the 177$ level as resistance on the TQQQ as an example going forward and see if we can crack that in the next few weeks as a countertrend rally develops (last weeks range was 137 to 176 on TQQQ).
Longer term, I see the graph in the following publication and wonder if we have a durable bottom here.
https://www.marketwatch.com/story/money-talks-and-money-flows-are-saying-dont-trust-this-rally-yet-2018-03-07
Cam has pointed out on multiple occasions, trading and investing has everything to do with ones investment time frame. For longer term, buy and hold capital, a durable bottom may still be ahead of us, for now, we may have a trading bottom close.
On an opening and closing basis, S&P, today had a intraday low of 2701 and close of 2726. In the futures markets, since S&P futures opened last night at 6 pm EST, the range was 2680-2720, give or take. I do not want to confuse nor mix the issue of futures and cash market, but only want to point out that in the cash market, closing lows may still be ways away from durable bottoms for long term capital.
Since 2/26, I see lower highs but higher lows. I interpret this price action as neutral. Whether or not to take a long postion now is dependent on your ability to handle drawdowns. I am very risk-averse. Therefore, until I see higher highs & higher lows, I remain out & in cash.
There’s a guy I listen to once in a while that practically goes into a tirade and becomes incoherent when he sees a W pattern under a moving average – Well, “”There it is – LOOK – a W pattern under a moving average””.
I wonder why a tirade? It is what it is..