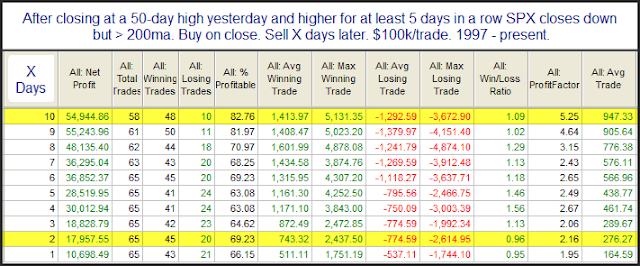
Mid-week market update: Rob Hanna at Quantifiable Edges highlighted a historical study of what happens if the market pulls back after a persistent move to new highs, where yesterday (Tuesday) was day 0. If history is any guide, stock prices should grind higher over the next 10 days.
Today was day 1 of that trading setup, and the market did not cooperate. The market’s failure to rise despite statistical tailwinds is a sign that it faces some near-term turbulence.
Let me explain.
Breadth divergences
A number of tactically bearish factors are becoming evident for the US equity market. The first is the appearance of a number of negative breadth divergences. As the chart below shows, the SPX has been rallying despite downtrends in net new highs-lows (second panel), % bullish (third panel), and % above 200 dma (bottom panel). In addition, the stock bond ratio (green line, top panel), which is a measure of risk appetite, is also exhibiting a negative divergence.
However, negative market breadth can only provide a warning as breadth is an uncertain market timing metric. It can take weeks, or months before breadth divergences resolve themselves with price action, if at all.
Hedge funds all-in on risk
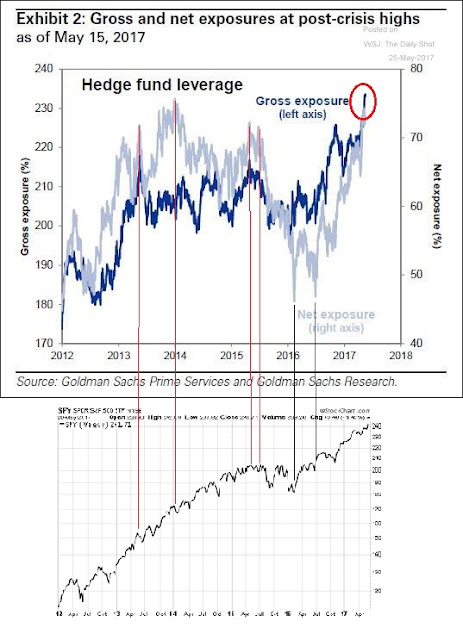
There are other warning signs. This chart from Callum Thomas sounded a contrarian warning. Hedge funds net leverage (light blue line) has risen to levels consistent with either short-term market tops, or consolidating tops (red line). By contrast, low net exposure has been signals of market bottoms.
In short, hedge funds are all in on risk. Be fearful when they are that greedy.
Faltering Twitter breadth
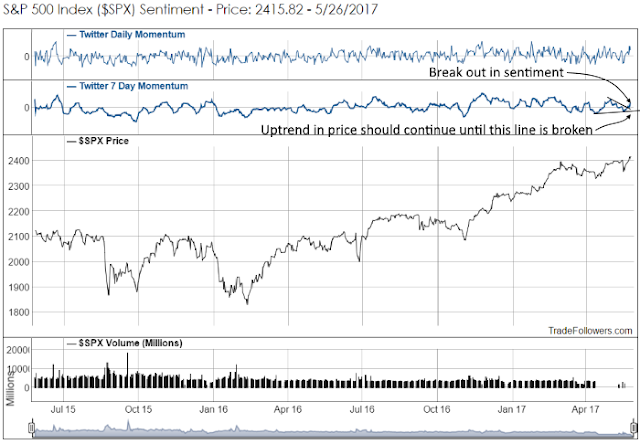
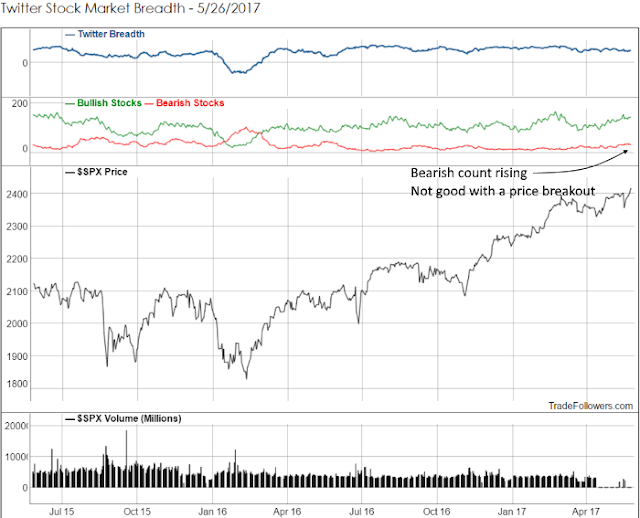
As well, Trade Followers wrote that Twitter breadth is starting to falter. This is important as Twitter breadth measures the sentiment of short-term high frequency traders, and this is a group who tends to gravitate towards FANG-like names that have been the market leaders.
Trade Followers observed that Twitter momentum broke up out of a downtrend, which is positive. However, this does not look like a positive pattern as the market tests all-time highs.
Despite the market’s apparent strength (post was written on the weekend), the breadth of bearish stocks was rising, which is not a good sign.
In conclusion, the combination of poor breadth, faltering momentum in Tech names, and contrarian signals from hedge fund positioning all point to near-term weakness ahead. This is purely a tactical call. As long as we continue to see positive momentum in fundamental and macro indicators, any pullback should be relatively shallow.
The trading model is therefore flipping from a bullish to a bearish signal. The “arrow” in the weekly chart will therefore change to an down arrow this weekend.
Disclosure: Long TZA


While I can understand choosing the weakest (Russell 2000 as of yesterday) index to short when the indexes are breaking down out of a base, but why do it in the middle of a base (no man’s land), especially when NDX v. RUT was showing itself at extremes which generally produce reversals. Wouldn’t SQQQ have been a better choice than TZA?
While a lot of your thesis for short term bearishness is built on weakening breadth, the S&P 500 Equal Weighted has broken to all time highs. How is your thesis challenged by this development?
The equal weighted S&P 500 is only one metric of breadth out of many. While it did break out to fresh highs on Friday, I would make several points:
1) The ratio of the equal to float weighted S&P 500 continues to trend downwards, indicating narrowing leadership
2) Other measures of breadth, such as net 52w highs-low, % bullish, % above 200 dma are in downtrends and flash negative divergence signals
There is considerable event risk on Thursday, namely the ECB meeting, UK election, and Comey testimony. Given the recent positive momentum exhibited by the market and sentiment readings indicating complacency, the prudent course of action is, at a minimum, to lower your trading book’s risk profile. A more contrarian stance would to put on a small short, which is what I have done in my trading account.