Business Insider recently featured a chart from Vanguard Group founder Jack Bogle, who observed that the market cap to GDP ratio has become highly elevated to its own history starting about 1996. You might recall that the market cap to GDP ratio was also said to be one of Warren Buffett’s favorite equity market valuation metrics, though he has been silent on the issue for a number of years.

What’s going on? Has the stock market become dangerously overvalued, or is this a New Era?
Decomposing the P/E ratio
The market cap to GDP ratio is really shorthand for a simplified aggregate price to sales ratio for the stock market. Most investors value stocks based on the price to earnings, or P/E ratio, which can be expressed as:
Price / Earnings = Price / (Sales X Net margin)
I went to FRED and charted the best approximation of after tax net margins, after-tax corporate profits to GDP. As the chart below shows, this ratio was range bound from 1947 to about 1994, when it began a secular rising trend.
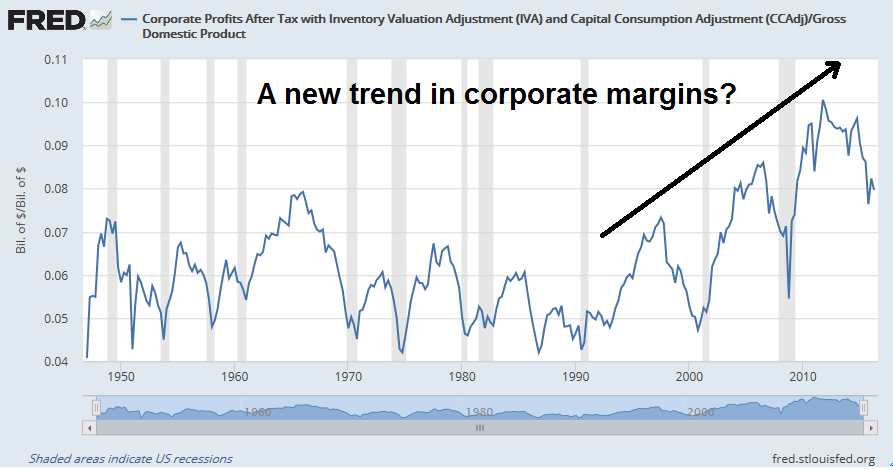
Secular vs. cyclical effects
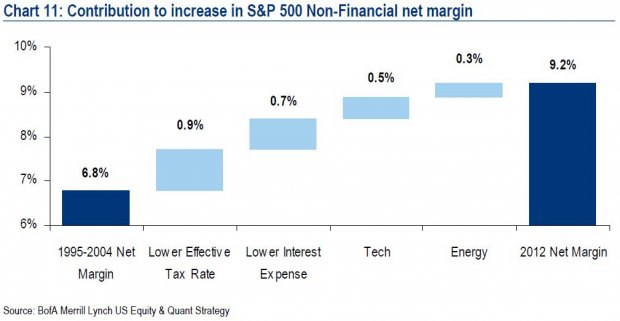
In other words, price to sales ratios are elevated because net margins have risen. The question for investors then becomes whether the rise in net margins is sustainable. Here, we have to distinguish between the secular and cyclical effects of the change in net margins. The secular trend can be explained by some old BAML analysis from 2014 (via Business Insider) showing that the rise in net margins was mainly attributable to lower interest expense (thank you, Federal Reserve) and lower tax rates (think Apple and tax inversion schemes).
On the other hand, Corporate America is operating in an economic environment where the labor market is at or near full employment. That’s when the cyclical effects are coming into play. The Atlanta Fed’s wage growth tracker shows steadily rising wage pressures, which will act to squeeze operating margins.
A survey of Avondale’s earnings call digest also reveals rising concerns over wage pressures on operating margins. Here is an excerpt from the 30-Sep-2016 digest:
Businesses are getting closer to full employment
“businesses are getting closer to full employment and we are seeing the checks per client slow, but we expect that frankly for the last couple of years as people came back from recession.” —Paychex CEO Martin Mucci (Payroll Processing)
Here is an excerpt from the 23-Sep-2016 digest:
Homebuilders continue to see tight labor markets
“there’s been very tight labor conditions across the country…we’ve had instances in some of our divisions where some contractors are coming back to us and basically saying they’re going to have to work over time with their folks or that they’re going to need to see some price increases in order to stay on the job.” —KB Home CEO Jeff Mezger (Homebuilder)
“Land is expensive. Land is hard to come by. People are expensive and hard to come by. It’s hard to grow operations efficiently and effectively at an accelerated rate in a market where land and labor is really constrained.” —Lennar CEO Stuart Miller (Homebuilder)
Bed Bath and Beyond is seeing wage pressure
“we believe payroll and wage pressure will continue. We’re not immune to it; it’s impacting our broader workforce including all of retail. It’s also something that we’re seeing…a more than one year impact that there are scheduled increases…for multiple years out” —Bed Bath and Beyond CEO Steven Temares (Home Goods)
Here is an excerpt from the 8-Sep-2016 digest:
Wage inflation is above 2% and the decline in food prices is moderating
“I think given the wage pressure, it’s probably slightly above the 2%…I mean, labor is — as Brian mentioned, we’re anticipating between 4% and 4.5% in the second half within that range also in the first half. So it’s a little more and [with] some reduced reduction in cost of sales on the food side, the margin side gets a little harder.” —Dave and Busters CEO Stephen King (Restaurant)
To circle back to the original question of whether the elevated market cap to GDP ratio represents a New Era, the answer is a qualified yes. However, investors should be aware of the rising cyclical headwinds that are likely to pressure operating margins in the near future.
Here are two charts showing valuation a different way. The first is S&P 500 dividend yield over the last 16 years with the average over that time shown. Take a look. Does this look like dangerous over-valuation?
https://product.datastream.com/dscharting/gateway.aspx?guid=f8c5d785-f80e-42c1-b813-eb9a8e3251bb&action=REFRESH
This is the same but I add the 10 year government bond yield.
https://product.datastream.com/dscharting/gateway.aspx?guid=2884a3e4-916c-4ed0-aaab-d955fa8a73b1&action=REFRESH
This shows stock yields rising while bond yields plunge over the 16 years From this, one would say stocks are a bargain.
When we expected interest rates and bond yields to revert to the old means, these dividend yields were not outstanding. Investor attitudes (mine too) when the Fed raised rates for the first time in seven years in December 2015, was that we would see rates ramp up four times in 2016 and then keep on going up. But shock of all shocks, that didn’t happen. Bond yields FELL instead. I don’t think we should underestimate how significant that is. Our collective viewpoint on the future levels of interest rates is changing to ‘lower for longer’. In that future, the dividend yield is king, not earnings. The yield on stock markets makes them a bargain.
BTW the projected growth of S&P 500 cash dividends over the next year is 7%. That is much more likely to happen than any forward projection of earnings and will make dividend paying stocks even more attractive.
Today’s institutions, pension funds and Boomer retirement oriented investors are yield hungry. The stock market is where they will gravitate to to get income. Earnings growth is a bonus but no longer the central theme.
This new bull market started early in 2016. It is a ‘lower for longer’ themed bull market. I say, “If you diss it, you’ll miss it.”
Ken / Cam – thoughts on considering shareholder yield, as opposed to only dividend yield?
Mark, I assume you are thinking of combining share buy-backs with the cash dividends to total a shareholder yield with the concept that the buyback portion will reduce shares outstanding of the company and hence boost earnings per share.
My view is that the buybacks did boost share prices as much or actually likely more until the ‘lower for longer’ market started. Back when earnings were driving stock prices, anything to boost earnings would create capital gains. S&P studies have documented this past outperformance of the buyback factor.
In the ‘lower for longer’ bull market, cash dividends are now the key. Aging Boomers want cash flow. The current outperforming factor is dividend yield according to recent S&P studies. I expect that boards of directors will see that share prices are being rewarded for raising dividends and so will switch to fewer buybacks to raising their company’s cash dividend. So success breeds success.
Cam, one of my longer-term concerns is that the current market multiples are based on expected future earnings growth rates which in turn are based on the last 10-20 years of earnings growth (and to which margin expansion had a large contribution). Even if margins are not mean-reverting, they will probably still reach some asymptotic limit. If secular margin expansion were to stop for a few years, market growth should start to mirror revenue growth, which over time could reduce P/E multiples to half of what they are today.
Aside from the fact that this shift will be slow and you can probably react to it, I’d love to hear your thoughts on whether you also perceive this as a real threat to long-term market valuation.
Sorry Swavek to butt in on this but let me offer something. The investment industry uses PE multiples as a measure but that is misleading. If you take the reciprocal you get an interest rate. So a 20 PE (price 20 on a dollar earnings) becomes 5%. That is call the earnings yield and it can be seen more clearly as a measure against the going interest rate level.
So your question is whether we will go from the current 5% earnings yield to twice that or a 10% earnings yield (10 PE). Given where interest rates will be, is that a reasonable assumption?
Back in 1980 when interest rates were 15% the PE on the market was 7 times or an earnings yield of 14.2%. Valuation of earnings is for a large part determined by the going interest rate within reason. With rates at 1% we would not see 100 PE.