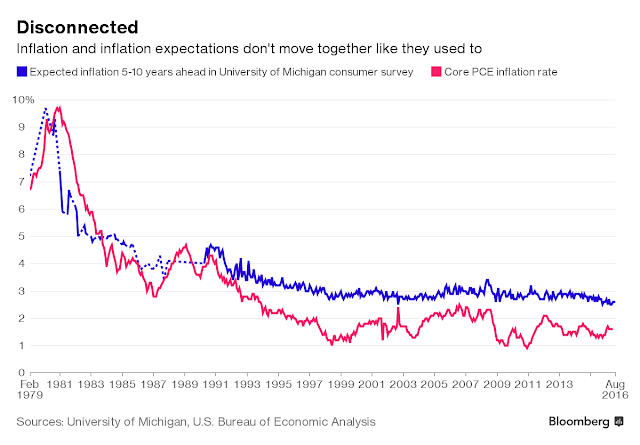
As we await the Fed`s annual Jackson Hole symposium on August 25-27, Bloomberg highlighted a research paper by Fed economist Jeremy Nalewaik. Nalewaik found that inflation and inflationary expectations had tracked each other well but started to diverge in the mid 1990’s.
This paper is important to the future of Fed policy, as it pushes the Fed towards a lower for longer view where inflationary potential is far lower than previously expected:
“Movements in inflation expectations now appear inconsequential since they no longer have any predictive content for subsequent inflation realizations,” Nalewaik wrote.
He cites as a potential explanation for this a hypothesis offered in a 2000 paper co-authored by Yellen’s husband, Nobel prize-winner George Akerlof, who wrote that “when inflation is low, it may be at most a marginal factor in wage and price decisions, and decision-makers may ignore it entirely.”
Akerlof’s and Nalewaik’s research jibe nicely with ideas that St. Louis Fed President James Bullard has injected into the debate on the rate-setting Federal Open Market Committee this year.
If this paper becomes a major focus at the Jackson Hole meeting, then the Fed is likely to tilt towards a take-it-slow view on raising interest rates. However, I would argue that this analytical framework is highly sensitive to how the Fed picks its input variables. One wrong move could result in a policy error of major proportions.
The Fed’s framework in context
For newbies, the Fed`s primary framework for setting interest rates is the Phillips Curve, which postulates an inverse relationship between unemployment and inflation. Policy makers could make short-term trade-offs between having lower unemployment at the price of higher inflation, or vice versa (chart via Wikipedia).
The part where the rubber meets the road is more difficult for policy makers. Models are interesting, but what do you plug into the chart for the inflation axis? Do you use some measure of inflation, or inflationary expectations? If you use inflationary expectations, here is a video of former Fed Chair Ben Bernanke where he outlines the debate of whether inflationary expectations are anchored at about 2%, or if they’ve become unanchored to the downside. The answer is that he has no idea.
There is a faction within the Fed, led by the likes of Lael Brainard, who argues that inflationary expectations are at risk of becoming un-anchored to the downside. If that is indeed the case, then the logical policy response is to keep interest rates lower for much longer. The Nalewaik paper is supportive of that case.
Which variable do you pick?
Theoretical discussions like these are very interesting from an intellectual viewpoint. However, an erroneous conclusion based on measurement error could have a disastrous effect on policy. The first chart of this post compares inflationary expectations from the University of Michigan survey to Core PCE, which is the Fed’s preferred inflation metric. The Nalewaik paper also shows other metrics of inflationary expectations, which are lower than the University of Michigan survey. If we were to substitute either of these measures for inflationary expectations, the divergence would be far lower than shown in our first chart.
So why did Nalewaik use the University of Michigan survey as his expectations metric? He cites as his reason being that “inflation expectations of the general public appear much more likely than the other candidate series to have a causal effect on actual inflation”.
In most economic models, firms set prices of goods and services in real terms, and since deviations from the optimal real price are costly to the firm, firms take into account expected aggregate price inflation in their pricing decisions. So the inflation expectations of the individuals setting prices of goods and services (i.e. “price setters”) should drive actual inflation, according to these theories.
Unfortunately, long time series on the inflation expectations of price setters are not available. What is available, broadly speaking, are the inflation expectations of the general public (from the Michigan survey), the inflation expectations of professional forecasters (typically economists), and, more recently, measures of inflation compensation derived from financial instruments whose payouts are linked to inflation. Based on several a priori considerations, the inflation expectations of the general public appear much more likely than the other candidate series to have a causal effect on actual inflation.
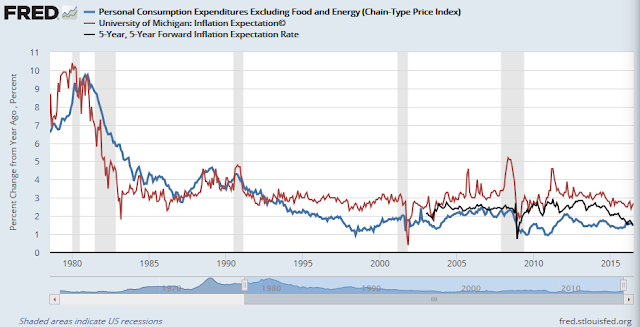
Here is the same chart of Core PCE against the University of Michigan survey (red line) and market based inflationary expectations (black line). The divergence between Core PCE and the market based forecast doesn’t look as serious. Arguably, firms seeking to raise prices also look to signals from the capital markets that determine their cost of capital, instead of strictly based on operating conditions from the “inflation expectations of the general public”.
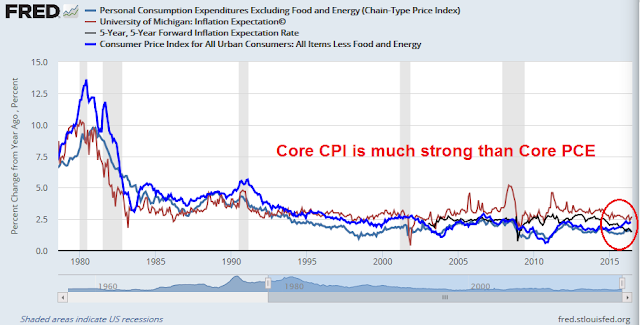
Just to confuse matters further, the chart below includes Core CPI as well as Core PCE as measures of actual inflation. Core CPI has been rising much stronger than Core PCE recently. So which is the correct inflation metric?
I have no answer to any of these questions. What these exercises do is to illustrate the sensitivity of inputs, as well as how the choice of different measures can have change policy by 180 degrees.
Here is the Atlanta Fed’s inflation dashboard, which illustrates the policy dilemma for the Fed’s policy makers. Most inflation metrics are elevated and the escalation in labor costs is signaling a possible return to cost-push inflation. On the other hand, inflationary expectations are extremely low by historical standards.
Here are the components of inflationary expectations. All metrics are low by historical standards, except for sticky price CPI.
Are you confused? I am.
Where does Yellen stand?
For investors, the crucial issue comes down to what Janet Yellen thinks. My simple rule of thumb is: what the Fed chair wants, the Fed chair gets. In this case, we have a number of clues from her past speeches.
In a speech on March 29, 2016, Yellen seems to be casting doubt about whether expectations are well anchored at 2%:
Although the evidence, on balance, suggests that inflation expectations are well anchored at present, policymakers would be unwise to take this situation for granted. Anchored inflation expectations were not won easily or quickly: Experience suggests that it takes many years of carefully conducted monetary policy to alter what households and firms perceive to be inflation’s “normal” behavior, and, furthermore, that a persistent failure to keep inflation under control–by letting it drift either too high or too low for too long–could cause expectations to once again become unmoored.
…Lately, however, there have been signs that inflation expectations may have drifted down. Market-based measures of longer-run inflation compensation have fallen markedly over the past year and half, although they have recently moved up modestly from their all-time lows. Similarly, the measure of longer-run inflation expectations reported in the University of Michigan Survey of Consumers has drifted down somewhat over the past few years and now stands at the lower end of the narrow range in which it has fluctuated since the late 1990s…
…Taken together, these results suggest that my baseline assumption of stable expectations is still justified. Nevertheless, the decline in some indicators has heightened the risk that this judgment could be wrong.
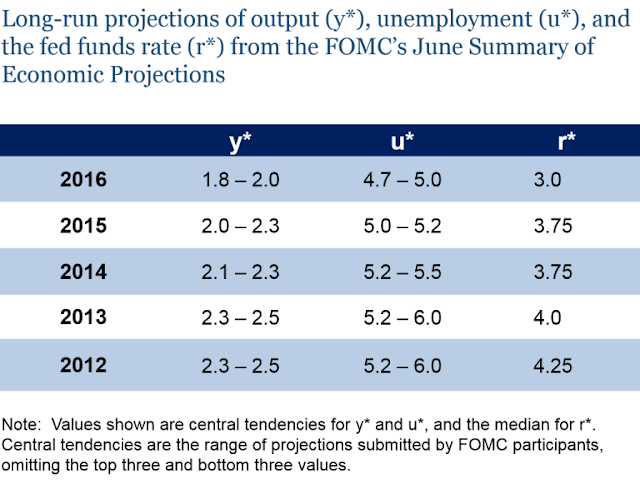
In addition, I recently highlighted an important essay by Ben Bernanke. The Bernanke essay outlined the evolution of the Fed’s estimates of long-term economic growth (y*), unemployment (u*) and interest rates (r*),
According to the table, the latest consensus estimate of equilibrium Fund Funds rate (r*) is 3.0%. However, a speech by Janet Yellen on June 6, 2016 indicated that she believed the “neutral rate” only needs to rise about 1% from current levels, which is far below the consensus:
One useful measure of the stance of policy is the deviation of the federal funds rate from a “neutral” value, defined as the level of the federal funds rate that would be neither expansionary nor contractionary if the economy was operating near potential. This neutral rate changes over time, and, at any given date, it depends on a constellation of underlying forces affecting the economy. At present, many estimates show the neutral rate to be quite low by historical standards–indeed, close to zero when measured in real, or inflation-adjusted, terms. The current actual value of the federal funds rate, also measured in real terms, is even lower, somewhere around minus 1 percent.
Taken together, Janet Yellen`s view of where Fed policy should be is definitely on the dovish side of the dove-hawk spectrum. I therefore reiterate my case for a market bubble. The combination of wrong-footed positioning by investors, a growth surprise and a Federal Reserve that is unlikely to “take away the punch bowl” anytime soon suggests that stock prices could rally to levels that are not in anyone’s spreadsheet (see my weekend post Party like it’s 1999, or 1995?).
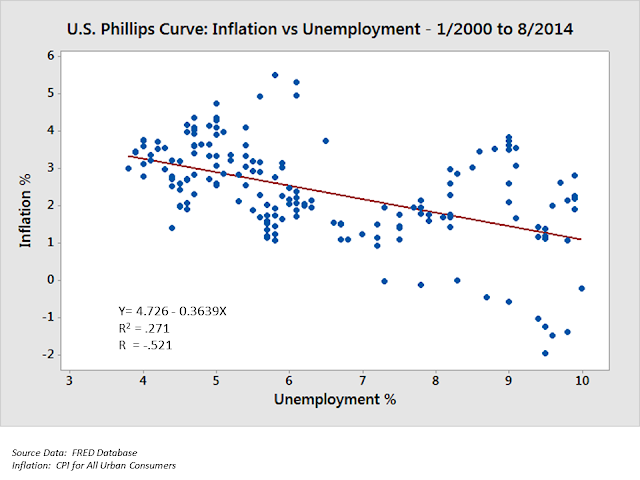
The Phillips Curve data leave much to be desired. The r-squared value of .27 is usually interpreted to mean that 27% of the variance in the y variable (inflation) can be predicted from variation in the x variable (unemployment) which of course implies that 73% of the inflation variability CANNOT be explained by unemployment variation. To make matters worse, simple regression assumes that the data are normally distributed on both axes which is clearly not the case for unemployment where there exist few observations in the 4 – 6% range. The ‘hole in the middle’ renders the plot more of a binomial, high vs. low nature rather than a continuous variable. This might lead to the consideration of much more interesting questions as to the causes of relatively high vs. low unemployment economic states.
Any attempt to argue that the regression is valid because it is ‘statistically significant’ is incorrect because the regression itself is invalid due to the nature of the data. A plot of the residuals (difference between the predicted values and the actual values for the the y-data) would not be normally distributed which would confirm the inappropriateness of a simple bi-variate regression model to these data.
There are also caveats with using percentage data in regressions but it is not likely a large problem given the small variable ranges utilized.
In summary, I would sincerely hope that the Fed is using something much more rigorous that these data to influence its policy decisions.
Correction – the hole in the data is in the 6 – 8% range.
Roy
I am reading the first of a series of articles in Wall Street Journal from Friday, 26th August, 2016 titled the The Great Unravelling. The first article in the series is titled Fed stumbles field populism, front page of the newspaper. There is a writeup by Lawrence Summers that describes how inflation did not pick up with falling unemployment (in the recent past say last decade; the time frame is not defined here). Is there a regression analysis that shows on what factors inflation depends on? Unemployment may be just one factor in inflation and I am sure there are many others. The statements I read in the lay press appear to base inflation as an overwhelming function of unemployment. How significant is unemployment when all other factors are considered? Thanks.
PS: Yes, I am familiar with the Phillips curve.
Roy, I see your comments as the r squared value is 0.27. So, what then are other variables? Do we have r squared values for those variables?
Roy’s comment on how unreliable the Phillips curve is for determining policy is quite intriguing. I too hope – with little basis – the Fed is using more rigorous data for setting monetary policy.
More troubling is the comment by Nalewalk, that “In most economic models, firms set prices of goods and services in real terms, …”. Regrettably this is likely a common expectation in the Nalewalk-Yellen household as well. Having run several small businesses wherein I was required to set prices I assure the Nalewalk-Yellen household that inflation expectations played no role. Competitive positioning and cost of goods sold were the only factors. To presume market players use inflation expectations for price setting is to presume circular reasoning.
Suppose I expected higher future inflation and therefore set my prices higher. My competitors would eat my lunch, my business would suffer, quite possibly fail and my expectations would be for naught. To expect lower future inflation and thus to set my prices lower than my competitors might provide me a business boost but at the cost of leaving money on the kitchen table so to speak.
Especially troubling is this belief by economists, both in general and in specific at the Fed, that inflation expectations by the general public are of some information value. In truth they are just a reflection of the media pushing one theme or another. In turn the media repeats the endless Fed speak. With Fed members constantly bleating about low inflation – indeed, deflation fears – and the media repeating this mantra endlessly the result is a general public gradually accepting this theme. Then simply regurgitating it when surveyed. It is the economic version of a popularity contest.
Both economics and finance are endeavors with low signal-to-noise ratios. There is a lot of noise in the data and the economy has many moving parts. In addition, monetary policy operates with a lag so it’s like trying to turn a oil tanker around in a storm and rough currents.
Policy makers do the best they can and, even though I disagree with them sometimes, it’s a tough job that I wouldn’t want.