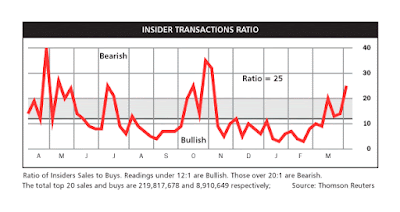
A reader raised a question after my generally bullish weekend post (see Equities in a macro sweet spot). The latest report from Barron’s of insider activity had shown that readings had risen up into sell signal territory. How worried should investors be about this development?
Insiders tend not to be short-term traders and they have long time horizons. The issue of capital gains vs. short-term trading gains are always on their minds, which means that their holding period is at least one year. If they sell, they have to worry the wash sale rule. So should you react to a single data point of insider activity?
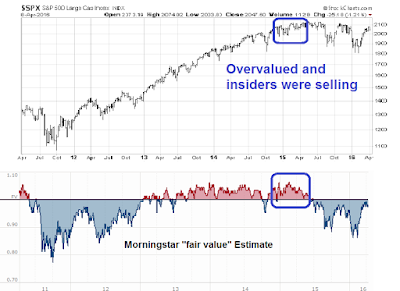
For a longer term perspective, here is a chart of the stock market and insider activity over the last couple of years.
As weekly data points can be noisy, I tend to look for clusters of insider buying and selling as a signal. We saw that there were upward spikes in insider selling in August 2014 and October 2015. In both cases, the initial signals were overly early as sell indicators.
There was also an episode of prolonged insider selling in the December 2014 to May 2015 period. The stock market continued to grind up, but stock prices did not make much headway.
Combining insider activity with valuation
Given the longer term investment time horizon of insiders, one useful metric to confirm the signals of their activity would be valuation, which is a better long term buy and sell indicator. My quick-and-dirty approach to valuation is to use the Morningstar fair value estimate to see if the median stock is over or under valued.
As the chart below shows, Morningstar shows the market to be slightly undervalued today. As well, the last prolonged period of high levels of insider selling (Dec 2014 – May 2015) also coincided with an overvalued market. The combination of high insider selling and overvaluation was a red flag that the upside potential for stocks was limited. Readers will recall that I grew increasingly cautious in the spring of 2015, which was a highly unpopular and contrarian viewpoint at the time (see Why I am bearish and what would change my mind written May 18, 2015).
This analysis also shows that the relationship of both valuation and insider activity and short-term returns is relatively weak, though the signals get better as the time horizon gets extended.
Today, we have a single data point showing that aggregate insider activity had moved into the “sell” zone, but valuations don’t appear to be excessive. How panicked should investors be about that combination?


Hello Cam,
I see that since the post, the Morningstar fair value estimated has risen to as high as 1.03, which is the first time it has got to overvalued territory since May 2015.
Also, the insider selling data has skyrocketed to 36.
At the same time, price action in market continues to act well and even the banks are joining the rally, which keeps me thinking long.
What do you make of all this ?
Thanks
The Morningstar estimate has risen to 1% overvalued, which is still a blip at this point. As recent history has shown, the market can still advance with moderate overvaluation.
I will have a more complete roadmap for the rest of 2016 and early 2017 coming out tomorrow that addresses a lot of these macro issues.