Preface: Explaining our market timing models
We maintain several market timing models, each with differing time horizons. The “
Ultimate Market Timing Model” is a long-term market timing model based on the research outlined in our post,
Building the ultimate market timing model. This model tends to generate only a handful of signals each decade.
The
Trend Asset Allocation Model is an asset allocation model that applies trend-following principles based on the inputs of global stock and commodity prices. This model has a shorter time horizon and tends to turn over about 4-6 times a year. The performance and full details of a model portfolio based on the out-of-sample signals of the Trend Model can be found
here.
My inner trader uses a
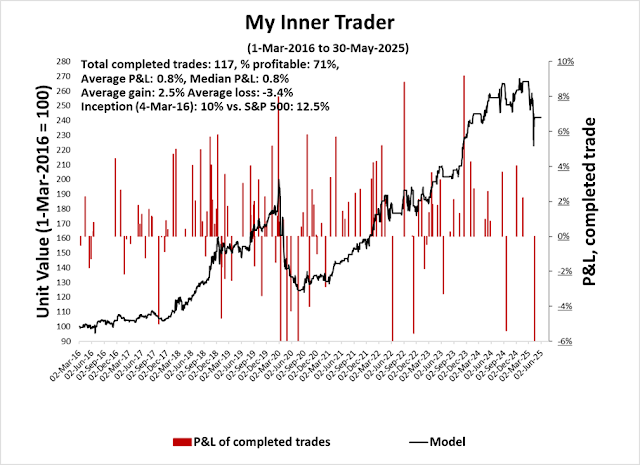
trading model, which is a blend of price momentum (is the Trend Model becoming more bullish, or bearish?) and overbought/oversold extremes (don’t buy if the trend is overbought, and vice versa). Subscribers receive real-time alerts of model changes, and a hypothetical trading record of the email alerts is updated weekly
here. The hypothetical trading record of the trading model of the real-time alerts that began in March 2016 is shown below.
The latest signals of each model are as follows:
- Ultimate market timing model: Buy equities (Last changed from “sell” on 28-Jul-2023)
- Trend Model signal: Neutral (Last changed from “neutral” on 16-May-2025)
- Trading model: Neutral (Last changed from “bullish” on 14-Apr-2025)
Update schedule: I generally update model readings on my site on weekends. I am also on X/Twitter at @humblestudent and on BlueSky at @humblestudent.bsky.social. Subscribers receive real-time alerts of trading model changes, and a hypothetical trading record of those email alerts is shown here.
Subscribers can access the latest signal in real time here.
Bullish Exhaustion
You can tell a lot about market psychology by the way it responds to news.
The accompanying chart shows how the S&P 500 responded in the extended trading hours and during the trading day to important news. Why did the S&P 500 rally 2.1% after Trump announced he was pausing the 50% tariffs on the EU for a month? Why did the index initially rally but ended the trading day with just a 0.4% gain last Thursday when the U.S. Court of International Trade ruled that Trump exceeded his authority when he imposed “Liberation Day” tariffs and the tariffs on Canada, Mexico and China for fentanyl smuggling?
Stock prices weakened Friday in reaction to an angry social media declaration by President Trump that China had violated its trade agreement. I interpret the market’s inability to react to good news as a sign of bullish exhaustion.
Poised to Rally
Hedge fund positioning is supportive of a beta chase on good news. Although gross exposure, which reflects the use of capital, is high, net exposure, which reflects directional exposure, is roughly neutral by historical standards.
Similarly, CTA trend followers have recovered from an extreme short position to neutral.
Key Risks
Why didn’t stock prices rally on the news?
You can always point out the risks in hindsight. The S&P 500 is trading at a historically elevated forward P/E of 21.3, which limits upside potential as trade war uncertainty hangs over the market.
The combination of an elevated forward P/E with an above average and decelerating rate of quarterly EPS revisions poses headwinds for equity prices.
One other key risk to asset prices is posed by the bond vigilantes, who recently flexed their muscles by throwing a minor tantrum.
If tariffs are rolled back by the courts, it would expose a big hole in the government’s budgeting process.
The Budget Lab estimates the court decision represents a $2 trillion revenue loss over 10 years, which makes the new budget a tough sell for the fiscal hawks in the Republican Party. Treasury Secretary Bessent would be faced with the risk of another bond market tantrum if nothing is done.
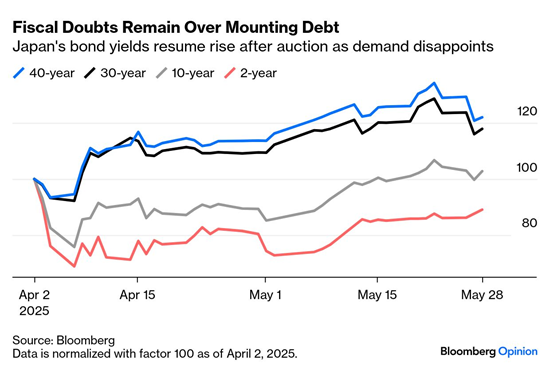
Fortunately, the bond market was calm and Treasury yields fell in the wake of the court decision, but risks remain. In particular, bond yield risk is emerging in Japan after a series of disappointing JGB auctions.
Japan’s debt to GDP is over 250%, and the BoJ already owns over half of the country’s debt. As JGB yields rise, the risk of Japanese investors repatriating funds from abroad to take advantage of rising Japanese yields is increasing. Already, Japanese and U.S. 30 years are highly correlated. Further upward rate pressure in Japan could resolve in a disorderly unwind of the Yen carry trade and a global risk-off stampede.
An analysis of the Trump policy equity factors shows the bearish backdrop is continuing. The trade war factor unexpectedly edged up on the news of the court decision, indicating greater tariff anxiety. Inflation expectations and Sell America factors edged up. The court decision and subsequent Trump Administration appeal are elongating the period of trade war uncertainty.
In particular, further strength in the Sell America trade would exacerbate a Yen carry trade unwind.
A Range-Bound Market
The market’s inability to rally on good news was a sign of bullish exhaustion. The recent violation of an upward sloping trend line in the face of positive news reinforces my view that the U.S. equity market is in a wide trading range. Technical conditions point to either a pullback or consolidation in the short-term.
Elevated valuation and continued uncertainty over trade policy, fiscal policy and the growth outlook all serve to create a roof over stock prices and the S&P 500 is unlikely to exceed its all-time highs in the near future. On the other hand, market panics will activate a Trump Put at levels defined by the April lows.
As well, option market sentiment has become a little overly frothy. The 10 dma of the CBOE put/call ratio recycled after falling below its one-standard deviation Bollinger Band. While this isn’t necessarily outright bearish, similar episodes in the last two years has seen the S&P 500 struggle to advance under such conditions.


Your first chart shows a really high level of overall positioning. Net is normal, but someone in the overall group is short and someone is long, could be hedged of course, but either way this could be a source of volatility, to the upside or the downside.
Volatility aside, considering the fact that the market is near all time highs in spite of everything going on is also perhaps a sign that things will go up when this consolidation is done.
The other thing is that budget deficits continue, and that money goes somewhere. Consider that since 1992 the federal deficit has gone up 9 fold and the SPX has gone up 15 fold. They are correlated. Of course one could say this means we need a 40% drop in the SPX to get to even, or we go nowhere until the deficits bags another 67% to be evenly priced by this “metric”. I’m not saying it’s a good metric, but the correlation is there, whether it is fictitious or not I don’t know.