Preface: Explaining our market timing models
We maintain several market timing models, each with differing time horizons. The “
Ultimate Market Timing Model” is a long-term market timing model based on the research outlined in our post,
Building the ultimate market timing model. This model tends to generate only a handful of signals each decade.
The
Trend Asset Allocation Model is an asset allocation model that applies trend-following principles based on the inputs of global stock and commodity prices. This model has a shorter time horizon and tends to turn over about 4-6 times a year. The performance and full details of a model portfolio based on the out-of-sample signals of the Trend Model can be found
here.
My inner trader uses a
trading model, which is a blend of price momentum (is the Trend Model becoming more bullish, or bearish?) and overbought/oversold extremes (don’t buy if the trend is overbought, and vice versa). Subscribers receive real-time alerts of model changes, and a hypothetical trading record of the email alerts is updated weekly
here. The hypothetical trading record of the trading model of the real-time alerts that began in March 2016 is shown below.
The latest signals of each model are as follows:
- Ultimate market timing model: Buy equities (Last changed from “sell” on 28-Jul-2023)
- Trend Model signal: Neutral (Last changed from “bullish” on 15-Nov-2024)
- Trading model: Bullish (Last changed from “neutral” on 28-Feb-2025)
Update schedule: I generally update model readings on my site on weekends. I am also on X/Twitter at @humblestudent and on BlueSky at @humblestudent.bsky.social. Subscribers receive real-time alerts of trading model changes, and a hypothetical trading record of those email alerts is shown here.
Subscribers can access the latest signal in real time here.
A test of the 200 dma
The S&P 500 fell last week to test support at the 200 dma. Many elements of a tactical bottom are there, but not all. The 5-day RSI exhibited a bullish divergence and so did the 52-week highs-lows spread. The VIX Index is trading above the upper end of its Bollinger Band, indicating a deeply oversold condition. The only question mark is the lack of an oversold reading on the percentage of S&P 500 above their 20 dma (bottom panel).
Nearing a short-term bottom
Most of the elements of a short-term bottom are in place.
Take, for example, the AAII weekly sentiment survey. I was surprised when the percentage of bears spiked to 60% two weeks ago. The latest week’s update showed a minor pullback in bearish sentiment, but readings remain elevated. These levels of sentiment are consistent with past short-term market lows.
Similarly, the term structure of the VIX is inverted, indicating high levels of fear (bottom panel) and the VIX Index is above 20. Such episodes of term structure inversions and high VIX in the last year have seen the S&P 500 resolve with short-term relief rallies.
A sense of panic may be setting in, as hedge funds have been dumping global equities at the fastest pace in history in the last two weeks, according to Goldman Sachs prime brokerage.
As the equity liquidation has been global, and the U.S. has recently lagged global stock markets, a momentum-based analysis suggests that the selling pressure was mostly concentrated on the U.S. stocks.
The one question is the put/call ratio. The 10 dma of the equity put/call ratio has reached levels where the S&P 500 has made short-term bottoms in the last year, but it hasn’t shown one or more single-day spikes consistent with panic sell-offs. Does sentiment need one final flush?
Here’s a plausible explanation for the lack of panic in the equity put/call ratio and the relatively elevated level of the percentage of S&P 500 above their 20 dma. The recent selling pressure has been concentrated in the Magnificent Seven, and breadth in the rest of the S&P 500 has been holding up well, though small caps have been weak. It’s an open question whether the S&P 493 has to fully capitulate before a short-term bottom can be made.
A de Gaulle or Liz Truss moment?
There are two obstacles to a relief risk-on rally.
The first and less well-known reason is a bond market tantrum, sparked by the news out of Germany that incoming Chancellor Merz has secured agreements with governing partners to a a €500 billion infrastructure fund and increased defense spending of at least €100 billion per year that are exclusions from the German fiscal debt brake. In addition, German federal states, which were required to balance their budgets, are now allowed to take out debt equal to 0.35% of GDP. The prospect of a flood of debt supply was enough to cause a surge in German yields, and even pushed Treasury yields upwards.
The transatlantic relationship break is becoming very real. Even French President Macron opened the door to extending the French nuclear umbrella to the rest of the European Union. It’s possible that these developments represent both a de Gaulle moment of independence from America in a geopolitical perspective and a possible Liz Truss bond market tantrum moment from a financial market viewpoint.
Trade war uncertainty
The other more visible source of volatility is Trump’s on-again and off-again trade war. Here is just the timeline from last week:
Tuesday: Trump announces a 25% tariff rate on Mexico and Canada
Wednesday: Trump exempts the auto industry for one month.
Thursday AM: Trump exempts most Mexican imports until April 2.
Thursday PM: Trump exempts most Canadian imports until April 2, but insults Canadian Prime Minister Trudeau.
Friday: Trump threatened immediate reciprocal tariffs on Canada.
Treasury Secretary Bessent also defended Trump’s trade policy by stating: “Access to cheap goods is not the essence of the American dream.” More disturbing for equity investors is his allusion to the elimination of a Trump Put: “Wall Street’s done great, Wall Street can continue doing well. But this administration is about Main Street.” (via
CNBC)
The high level of uncertainty is reflected in the volatility of my “trade war factor”, which has been in a steady uptrend since the election, but began to trade sideways in a very choppy manner in late January.
All systems (almost) ready
Cutting through all the news-driven noise, I believe the stock market is poised for a relief rally, though it may be in need of a final sentiment flush.
Three of the five components of my tactical Bottom Spotting Model flashed buy signals last week. In the past, two or more simultaneous buy signals were sufficient for short-term bottoms. As previously discussed, the VIX Index rose above its upper Bollinger Band and the term structure of the VIX has inverted. In addition, the NYSE McClellan Oscillator reached an oversold level.
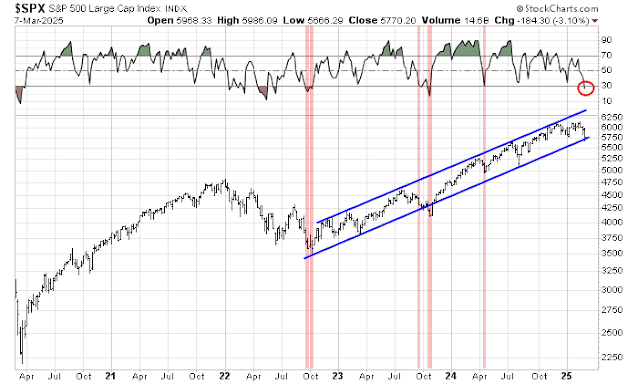
Here’s the weekly S&P 500 chart for a longer-term perspective. The index is now testing rising trend-line support while the 5-week RSI is oversold. Either the market bounces here or prices crack and stock prices enter a more serious bear phase.
I believe short-term conditions are sufficiently oversold to warrant a relief rally. Traders need to be a bit more patient.
My inner trader is maintain his long position in the S&P 500. The usual disclaimers apply to my trading positions.
I would like to add a note about the disclosure of my trading account after discussions with some readers. I disclose the direction of my trading exposure to indicate any potential conflicts. I use leveraged ETFs because the account is a tax-deferred account that does not allow margin trading and my degree of exposure is a relatively small percentage of the account. It emphatically does not represent an endorsement that you should follow my use of these products to trade their own account. Leverage ETFs have a known decay problem that don’t make the suitable for anything other than short-term trading. You have to determine and be responsible for your own risk tolerance and pain thresholds. Your own mileage will and should vary.
Disclosure: Long SPXL


reading the trade war uncertainty described above, leaves me wondering, is it possible that the priority of the current administration is to incentivize people to by US government bonds, instead of stocks? this would lower the cost of debt
Treasuries are not a good purchase if inflation is still a major issue. And if tariffs are inflationary…
Treasuries were fantastic during the deflationary recessions of 2000-2003 and 2008. I’d buy TLT on a whim if I knew the trade war was getting cancelled.