Preface: Explaining our market timing models
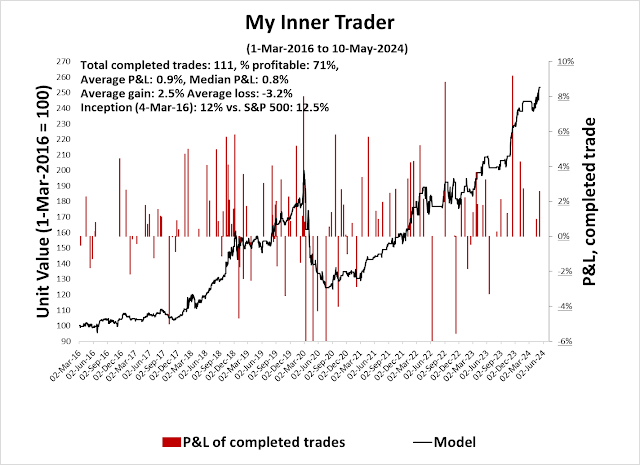
My inner trader uses a trading model, which is a blend of price momentum (is the Trend Model becoming more bullish, or bearish?) and overbought/oversold extremes (don’t buy if the trend is overbought, and vice versa). Subscribers receive real-time alerts of model changes, and a hypothetical trading record of the email alerts is updated weekly here. The hypothetical trading record of the trading model of the real-time alerts that began in March 2016 is shown below.
The latest signals of each model are as follows:
- Ultimate market timing model: Buy equities (Last changed from “sell” on 28-Jul-2023)
- Trend Model signal: Bullish (Last changed from “neutral” on 28-Jul-2023)
- Trading model: Bullish (Last changed from “neutral” on 10-May-2024)
Update schedule: I generally update model readings on my site on weekends. I am also on X/Twitter at @humblestudent. Subscribers receive real-time alerts of trading model changes, and a hypothetical trading record of those email alerts is shown here.
Subscribers can access the latest signal in real time here.
A good overbought advance
The S&P 500 violated a rising trend line in early April and corrected. It appears to have formed a V-shaped bottom and it is resuming its advance by clearing a resistance and volume congestion zone. It’s also exhibiting a series of “good overbought” conditions on the 5-day RSI. The “good overbought” rally will be confirmed if and when the 14-day RSI becomes overbought and stays overbought.
Market internals are pointing to another sustained upleg in stock prices. Here are four other reasons why.
A Triple 70 breadth thrust
The market printed a Triple 70 breadth thrust last week, defined as three consecutive days of NYSE advancing issues of 70% or more. Historically, such events tend to be signals of strong price momentum that are long lasting.
A case of good breadth
The advance has been accompanied by renewed strong breadth. Net highs-lows have turned positive for both NYSE and NASDAQ stocks, which is a sign of underlying strength.
In addition, the Advance-Decline Line is also showing signs of good breadth. Even though the S&P 500 is below its all-time high, most versions of the A-D Line have reached their previous highs, with the exception of the small-cap S&P 600 A-D Line.
Falling USD and yields
One of the headwinds posed by stock prices has been rising yields and USD strength, as the USD has been inversely correlated to stock prices. Yields have been retreating across the entire yield curve but remain above their upside breakout levels. The USD Index is similarly weakening and nearing a key resistance turned support level. Stock prices have the potential to undergo a parabolic advance should Treasury yields and the USD break support.
Supportive sentiment
Sentiment, as measured by the Fear & Greed Index, is supportive of a further advance. Readings are only starting to rise from a mild fearful condition and they are nowhere near greed levels, which indicate a frothy market.
From a sentiment modeling perspective, the relative performance of equal-weighted consumer discretionary stocks, which takes out the effects of heavyweights like Amazon and Tesla, has been a terrific contrarian indicator. Relative weakness in this sector has been strong S&P 500 buy signals, and they are now testing a key relative support zone.
In support of this contrarian bullish thesis, references to the “low end consumer” have surged in earnings calls..
Key risks
The bull case isn’t without risks. A review of the relative performance of defensive sectors shows that three of the four have rallied out of relative downtrends and they are either consolidating or starting to rise (Utilities). Leadership by defensive sectors would be an unwelcome development for the bulls.
In conclusion, a review of technical and sentiment conditions shows that stock prices are setting up for a sustained advance. The combination of strong momentum, good breadth and skeptical sentiment points to higher stock prices. Key risks are evidence of a disturbing relative strength by defensive sectors and an upcoming CPI report that could upend the bullish narrative.
I would like to add a note about the disclosure of my trading account after discussions with some readers. I disclose the direction of my trading exposure to indicate any potential conflicts. I use leveraged ETFs because the account is a tax-deferred account that does not allow margin trading and my degree of exposure is a relatively small percentage of the account. It emphatically does not represent an endorsement that you should follow my use of these products to trade their own account. Leverage ETFs have a known decay problem that don’t make the suitable for anything other than short-term trading. You have to determine and be responsible for your own risk tolerance and pain thresholds. Your own mileage will and should vary.


Triple 70 breadth thrust, wonder the track record. Googled serach, there is one article https://quantifiableedges.com/a-3x-70-breadth-thrust-signal/