

- Ultimate market timing model: Buy equities (Last changed from “sell” on 28-Jul-2023)
- Trend Model signal: Bearish (Last changed from “neutral” on 11-Apr-2025)
- Trading model: Bullish (Last changed from “neutral” on 28-Feb-2025)
Update schedule: I generally update model readings on my site on weekends. I am also on X/Twitter at @humblestudent and on BlueSky at @humblestudent.bsky.social. Subscribers receive real-time alerts of trading model changes, and a hypothetical trading record of those email alerts is shown here.
Subscribers can access the latest signal in real time here.
Out of Words to Describe “Oversold”

What’s the prognosis? What’s the market’s downside risk?
Support at 4800
From a technical perspective, the S&P 500 is oversold on the 14-week RSI and previous touches of this level have produced bounces, though not all have been successful. The index should see strong support at the 4800 level, which is the site of the long-term upside breakout, as well as the 50% retracement of the move from the 2022 low.

The Recession Question
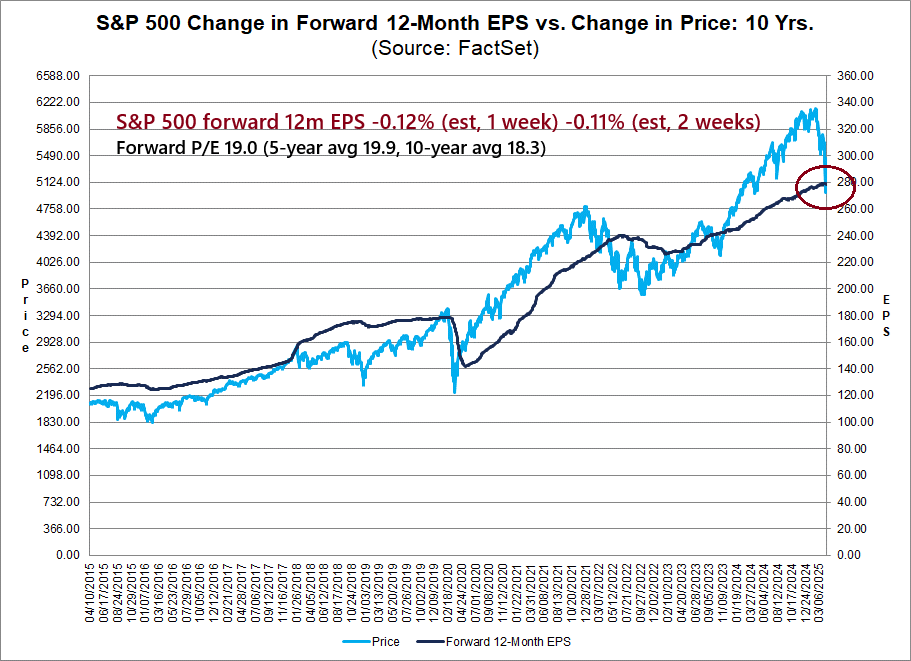
Much depends on whether the economy falls into recession. The S&P 500 forward P/E has normalized to 19.0, which is within historical norms. In the last 10 years, the S&P 500 has bottomed out at a forward P/E range of 14–16. Based on current earnings estimates, this would imply a downside S&P 500 range of 3900–4500. On the other hand, if the economy were to fall into recession and I pencil in a -15% decline in earnings estimates, the downside range falls to about 3300–3800.

Ominously, forward 12-month EPS estimates are falling just ahead of the Q1 earnings reporting season.
Climax Lows
Here is a technical interpretation of recessionary and non-recessionary lows. The recent bounce looks like a bounce off a climax low, but not all climax lows were the final lows; 93% of stocks on the NYSE advanced in response to the Trump policy pivot. There were seven cases of 90%+ advances during the 2008–2011 period, which covers the GFC and the Greek Crisis, which were recessionary lows. Only one of them (March 2009) occurred after the final low.

That said, the short-run experience of strong advances shows a degree of choppiness.

The 1962 experience is similarly instructive of a non-recessionary low. Technical analyst Walter Deemer pointed out that the market began falling in March owing to the Kennedy confrontation with U.S. Steel. It experienced three climax lows before reaching the final low in July. The market made a higher low in October during the Cuban Missile Crisis.

The current market trajectory is similar to the 1998 experience, which was a non-recessionary low sparked by the LTCM blow-up. The market bounced and weakened to re-test the old low.

A Bounce, Then What?
Sentiment indicators are supportive of a short-term bounce. AAII weekly sentiment remains in a crowded short reading.

Price momentum unwinds have run their course. Different indicators of price momentum (fast money) against quality (patient money) have normalized, and momentum has regained the upper hand. The market should bounce in a choppy fashion from here, especially in the wake of the news late Friday that Trump is exempting from Chinese tariffs smartphones and consumer tech.

What happens after the bounce?

Current odds of a recession on the betting site Kalshi is at 64%, which is just above the 60% from last week.

Another disturbing development is from the credit market. Yield spreads are blowing out, which is a recession warning, but readings don’t represent a recession signal. Combined with the turmoil in the Treasury market, these are worrisome signs from the credit markets.

In conclusion, the S&P 500 is deeply oversold by historical standards, but it remains an open question of whether stock prices will decline further after a short-term bounce. My estimate of S&P 500 downside is 3900–4500 without a recession, with strong technical support at 4800. Downside risk with a recession is 3300-3800. Current readings indicate elevated recession risk based on consensus policy expectations, which can change at any time.

Trend Model Downgrade

My inner trader is long the S&P 500. He plans to exit his position in the expected rally Monday. The trade war isn’t over. Investors will certainly see more setbacks as Trump tries to negotiate trade deals with numerous countries over the next 90 days. A re-test of the old lows is highly likely, and re-tests are not always successful.
maybe in this environment it makes more sense to use etfs like BIL, SHV, or even SHY in your 60% fixed allocation?
Thanks for your insight!
The anti-American sentiment being unleashed currently is underappreciated in the U.S. Nothing in our lifetimes have we seen anything remotely like the tearing down of friendly partnerships and global brands. Beggar thy neighbor will beggar thyself. Earnings outlook is open ended on the downside. Margins are absurdly high and at levels that can only happen in a strong economy not one in an austerity regime at home and anti-American globally. I believe the fall in earnings will be shocking.
America has become uninvestable for the next two years. I say that with incredible regret. China is uninvestable too. Fortunately we have a great opportunity birthing in Europe.
Starting now, we are seeing negotiations towards a trading partnership between Europe and China that will blossom into a mutually beneficial alliance. China just announced backing off on autos the biggest contentious issue. After that is solved, everything else can trade freely.
Europeans don’t worry about China pulling ahead of America on the world rankings, especially now that they are insulted everyday. They are okay with Chinese socialism.
Europe is banding closer together after the Zalensky disastrous White House meeting. They see they must defend themselves. Deficit spending is being unleashed as well as for infrastructure in general. Germany just changed its constitution to increase spending incredibly. As Trump turns his back, they will form a very productive partnership with China.
The Euro (FXE ETF) and especially the Swiss franc (FXF ETF) are rising. On Thursday’s big S&P 500 drop, the Swiss franc was up 4% and the Euro over 2% that day! I remember in the past when the Swiss government slapped a 10% negative interest rate on foreign deposits because the currency haven buying was sending their currency too high for their export industries. Are we heading for a time when wealthy global investors just want a safe haven in a global economic hurricane? Guess what I think.
China as part of this will force Russia to end its war.
It’s very difficult if not impossible to refocus on Europe after a lifetime of American centric investing. Momentum investing in outperforming ETFs rather than unfamiliar European stocks helps. But the discomfort is much less that going down the MAGA rabbit hole and trying to figure out what’s happening next with no solid ground underneath.
II would also look at an Indian etf.
have to agree with Ken, once again. The question of course is that, since in crises correlations go to 1, why would one invest in Europe right now? Is the rotation really so strong? Why not just wait until hi-yield spreads relax somewhat? Or wait for the Mid-Terms?
(I’m sitting on a lot of cash since March 12, being a pretty big fan of Andrew Thrasher’s 5% Canary system).
I hear you Martin. I do see a current shift in Euro currency that is uncorrelated and comes with with a positive longer-term trend change narrative that experts I trust confirm and recommend.. Euro equities have a different risk/reward outlook where timing later is safer. It is just that the massive shift in Euro government deficit spending rules will have immediate bullish implications.
got it, thanks!
Cam
After selling 20% stock positions, would the model portfolio be back to 60-40 or 80-20?
Thanks.
Model portfolio changes from 60% SPY and 40% IEF (natural) to 40% SPY and 60% IEF (bearish)
Thanks.
It feels awful, but it’s also too obvious.
Sentiment is so negative.
The put call ratio is high.
The inflation seems to be coming down which could get the Fed to cut rates.
What happened to all correlations going to 1? The market takes a hit but gold goes up. The 10 year yield goes up but the $ goes down.
It’s all messed up for sure, but is it a bear trap? The last one this cycle?
It makes me think of GME, it was too obvious a short at some point and became over-shorted and a squeeze happened.
There was no real surprise here, the tariffs had been telegraphed way ahead. As far as the global reaction, 4th turning. It’s not only in the USA that the middle class is squeezed, lots of po’ed people out there.
Everyone out there is an opportunist, so of course we hear all this news, and deals going on. Will China keep from flooding Europe with its cars? For how long?
Reducing risk sounds like a good idea.
I’ll paraphrase what the Trend Model is saying in English: The market is undergoing a global growth scare, though the jury is still out on the recession call. That’s why it’s prudent to reduce risk.
Thanks for the plane English.
The ES mini is making a cup and handle on the hourly chart with a target of 6200-6250.
This is the thing about chart patterns, they are like probability patterns…when they manifest it’s awesome, but they don’t always.
The cup is W shaped , double bottom and the handle bounced off the middle of the W. …Fascinating.
Cam,
Did your inner trader sell as you hinted over the weekend?
Yes I did
Ok, thanks. I asked because I didn’t see the update on the Inner Trader page.