Preface: Explaining our market timing models
We maintain several market timing models, each with differing time horizons. The “
Ultimate Market Timing Model” is a long-term market timing model based on the research outlined in our post,
Building the ultimate market timing model. This model tends to generate only a handful of signals each decade.
The
Trend Asset Allocation Model is an asset allocation model that applies trend-following principles based on the inputs of global stock and commodity prices. This model has a shorter time horizon and tends to turn over about 4-6 times a year. The performance and full details of a model portfolio based on the out-of-sample signals of the Trend Model can be found
here.
My inner trader uses a
trading model, which is a blend of price momentum (is the Trend Model becoming more bullish, or bearish?) and overbought/oversold extremes (don’t buy if the trend is overbought, and vice versa). Subscribers receive real-time alerts of model changes, and a hypothetical trading record of the email alerts is updated weekly
here. The hypothetical trading record of the trading model of the real-time alerts that began in March 2016 is shown below.
The latest signals of each model are as follows:
- Ultimate market timing model: Buy equities (Last changed from “sell” on 28-Jul-2023)
- Trend Model signal: Neutral (Last changed from “bullish” on 15-Nov-2024)
- Trading model: Neutral (Last changed from “bullish” on 17-Jan-2025)
Update schedule: I generally update model readings on my site on weekends. I am also on X/Twitter at @humblestudent and on BlueSky at @humblestudent.bsky.social. Subscribers receive real-time alerts of trading model changes, and a hypothetical trading record of those email alerts is shown here.
Subscribers can access the latest signal in real time here.
A bond market reversal
Last week, I highlighted the risk-off tone caused by the bond market tantrum that was under way. As the week progress, softer-than-expected PPI and CPI reports calmed the bond market vigilantes and yields retreated.
The reversal occurred just in time for the changing of the guard at the White House.
In search of policy clarity
While the rally in bond prices (and decline in yields) was constructive, it left Fed Funds policy expectations unchanged. The market continues to expect just one rate cut in 2025, with the first one occurring mid-year. In effect, the bond rally amounted to a reduction of the tail-risk of a Fed pivot to either stopping rate cuts or even raising rates in response to runaway inflation.
As Trump takes office, expectations had been building for his policies. But volatility risk will stay high until investors see some actual clarity and concrete actions by the new administration.
Treasury Secretary designate Scott Bessent offered some guidance on Trump’s economic policies when he testified at his Senate confirmation hearing. Bessent confirmed that Trump will impose tariffs, though the implementation timeline is unclear. There are three reasons for tariffs. The first is to remedy unfair trade; the second is to raise revenue for Treasury; and the third is a tool to negotiate with other countries, such as Trump’s threat to impose 25% tariffs on Canada and Mexico if they didn’t address U.S. border issues.
In addition, Bessent affirmed that the Trump Administration is committed to the extension of the TCJA tax cuts and called it “the single most important economic issue of the day”.Now that the market is starting to see some policy clarity, what will the upcoming changing of the guard bring?
How far can the rally run?
Let’s assess how equity market conditions have evolved. I was pounding the table that the market was oversold and poised for a relief rally. The relief rally began last week and it was sparked by the bond market rally.
Conditions aren’t oversold anymore. The S&P 500 is broke through overhead resistance at its 50-dma and falling trend line (dotted line). Moreover, some indicators, like the NYSE McClellan Oscillator, have reached an overbought extreme. Other indicators, such as the percentage of S&P 500 above their 20 dma, have exceeded my minimum upside target of 65%.
Can the market rally further?
Certainly. The S&P 500 rose 1% Friday, which qualifies as an IBD follow-through day, indicating positive momentum. However, Friday’s rally was slightly unconvincing as it was accomplished with a doji candle, signaling indecision and possible trend reversal. The next upside target for the S&P 500 is its all-time high at about 6100. Additional resistance can be found at the rising trend line (dotted red line) at about 6300.
Before the bulls become overly excited, let’s take it one step at a time.
Where’s the fear?
I have been concerned about the lack of extreme fear during this latest oversold episode.
The stock market was extremely oversold in December, but option sentiment showed no evidence of a fear spike in the put/call ratio that was in evidence at recent tactical bottoms.
The AAII weekly sentiment survey is showing similar readings of elevated concern, but no panic.
No compelling buy signals
The lack of fear during this latest oversold episode is an argument that the relief rally is likely to fizzle sooner rather than later.
To be sure, technical conditions are constructive but there are no compelling buy signals. Breadth is broadening out, which is helpful to the bull case.
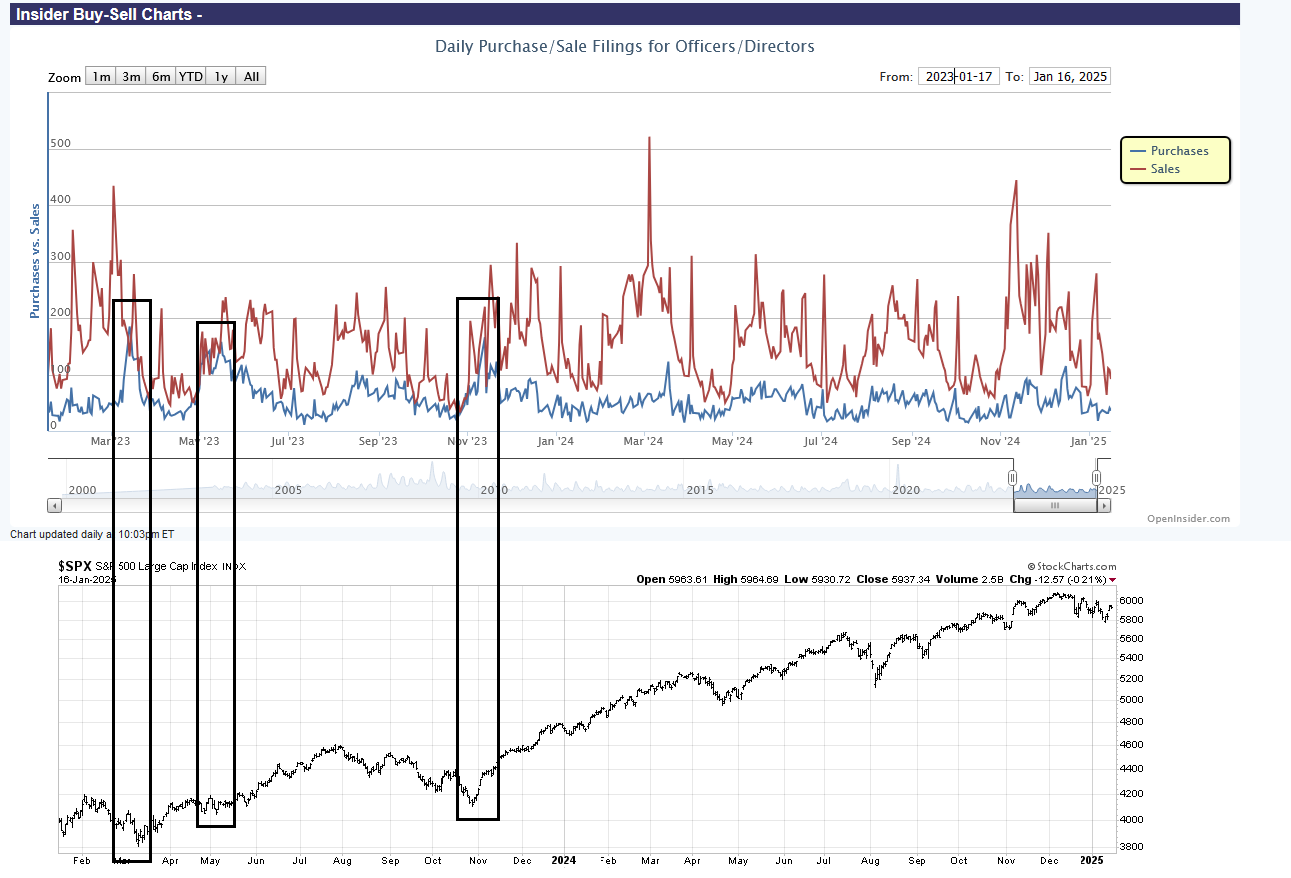
A review of insider activity did not show strong insider buying in the December downdraft, when insider buying (blue line) exceeded insider selling (red line). While the lack of insider buying isn’t necessarily bearish, it does give support to the case that the relief rally may not be sustainable.
As well, risk appetite indicators present a mixed picture. The relative performance of junk bonds is bullish, while the relative performance of high beta to low volatility stocks yields a neutral signal.
The lack of small-cap strength during a period of seasonal strength for smal-cap stocks is equally concerning.
Lastly, the negative divergence in the extreme animal spirits tail of the market is disconcerting. Bitcoin is rallying based on the cryptocurrency friendly policies of the Trump Administration.. Bitcoin prices had been correlated with the relative performance of speculative growth stocks, as measured by the ARK Investment ETF. In the current instance, speculative growth is exhibiting a series lower lows and lower highs.
In conclusion, much of the gains from the relief rally that I called for are likely in the rear-view mirror. The lack of extreme fear during this latest oversold episode makes me question the longevity of the rally. In light of the uncertainties posed by the changing of the political guard in the U.S., the prudent course of action for traders is to step aside and wait for greater clarity before taking further action.
In the coming week, the market is likely to focus on the new directions of the new Trump Administration. The downside risk of Trump’s signature electoral promises, such as the negative growth from tariffs and deportations, can be implemented immediately with executive orders, while the upside potential of his pro-growth policies, such as the tax cut extension and deregulation, need legislative approval that depend on a razor-thin House majority.
As we saw with the H-1B decision, some Trump constituents are likely to be disappointed, and the potential for market disappointment is elevated.


Thanks for this excellent article. You have shared both bull and bear case based on current technicals.
I would pay more attention to the confounding factors (as shown by you in this missive) that are against a sustained bull market, and not ignore them. Markets hate uncertainty and we seem to be heading into some significant political uncertainty, or so it seems. Time will tell.
Indeed market risk exists but probably not alarming. There will be more contradictory indicators and/or more divergencies because Trump is more unpredictable and his style is swift. This makes a group of people hesitant to commit more in investment. The better approach is to step back and do not examine markets too much in details. The econ backdrop is normal. Large caps and especially financials are doing well. After two years of big returns it is time for indices to rest. It is healthier this way.
One thing we will notice is the DC clean-up. There will be some high profile indictments, based on evidence not politics. Watch Pam Bondi, the new AG, and Kash Patel, the new FBI boss, give us a spectacular show. Some investors might think this is not related to investing. It actually is. One prime example is LNG. Biden’s hindrance to US LNG export to Europe last several years has rendered this area uninvesttable, until now. A waste of opportunity. It is actually Biden’s puppet masters calling this shot, for several motives. One is to put Ukraine at disadvantages, and the other is to damage oil&gas industry because of this green delusion. There are others which simply are related to corruption. We should see a more balanced and more transparent investment environment. Lest we don’t waste time on research and derailed by politics/ideology.