There are many eerie similarities. Today’s stock market is struggling to regain its highs after a rally after Trump’s electoral win. The Advance-Decline Lines are also weak and technical analysts have expressed concerns about negative breadth divergences. The key difference is the Volcker Fed raised interest rates to punishingly high levels during Reagan’s era, while today’s Fed is pursuing a policy of monetary easing. The 2-year Treasury rate, which is a proxy for Fed Funds expectations, rose steadily and didn’t top out until August 1981.
Cyclical bullishness
The Republican enthusiasm over the promise of Trump’s pro-growth policies saw cyclical industries outperform.
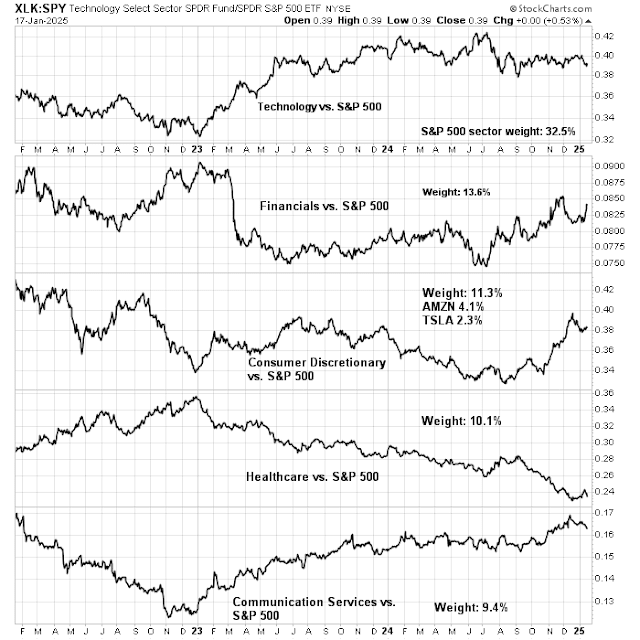
However, the bond market has pushed up yields in anticipation of higher inflation under Trump. As a consequence, the high duration NASDAQ 100 growth stocks, which are more interest rate sensitive, have begun to lag the market.
The rotation amounts to a form of rolling correction. An analysis of the relative performance of the top five sectors by weight shows that large-cap growth sectors account for nearly half of S&P 500 weight, while the other components in the index, such as financial and healthcare stocks have taken up the mantles of leadership.
Challenges to the cyclical bull case
The key question for investors is the sustainability of the cyclical leadership. If the cyclical rebound, which is reflationary, is sustainable, the stock market should break from the Reagan era 1980–1981 pattern and advance to fresh highs. If it fails, the 1981 pattern is in play and investors have to consider that the market is in the process of making an intermediate-term high for the current expansion cycle.
Here are the challenges to the cyclical and reflationary bullish scenario.
Similarly, the cyclically sensitive industrial metals have staged a minor rally but the trend is flat to down. Does global cyclical reflation look like this?
Much like the 1980–1981 episode, Advance-Decline Lines are weak. Even though the S&P 500 regained its 50 dma, all of the other A-D Lines are below theirs. However, the breadth divergences today are only minor and don’t represent a cause for alarm just yet.
The stock market became extremely oversold in December, but option sentiment showed no evidence of a fear spike in the put/call ratio that was in evidence at recent tactical bottoms. Other sentiment indicators, such as the AAII weekly survey, show a similar lack of alarm. Unless stock prices skid and market sentiment pivots to panic, the latest attempt at a relief rally is likely to fizzle and the narrative of a cyclical rebound is likely to evaporate. In the alternative, the bulls need to muster a strong breadth thrust and inter-market signs of global cyclical strength, such as industrial metal strength, for a convincing reflationary bull move.
In conclusion, history doesn’t repeat itself but rhymes. The current market pattern is eerily similar to the 1980–1981 period when Ronald Reagan first won when the market made an intermediate-term top. Reagan entered the White House amidst a wave of partisan enthusiasm but the stock market ran into technical and economic headwinds.


