Preface: Explaining our market timing models
We maintain several market timing models, each with differing time horizons. The “
Ultimate Market Timing Model” is a long-term market timing model based on the research outlined in our post,
Building the ultimate market timing model. This model tends to generate only a handful of signals each decade.
The
Trend Asset Allocation Model is an asset allocation model that applies trend-following principles based on the inputs of global stock and commodity prices. This model has a shorter time horizon and tends to turn over about 4-6 times a year. The performance and full details of a model portfolio based on the out-of-sample signals of the Trend Model can be found
here.
My inner trader uses a
trading model, which is a blend of price momentum (is the Trend Model becoming more bullish, or bearish?) and overbought/oversold extremes (don’t buy if the trend is overbought, and vice versa). Subscribers receive real-time alerts of model changes, and a hypothetical trading record of the email alerts is updated weekly
here. The hypothetical trading record of the trading model of the real-time alerts that began in March 2016 is shown below.
The latest signals of each model are as follows:
- Ultimate market timing model: Buy equities (Last changed from “sell” on 28-Jul-2023)
- Trend Model signal: Bullish (Last changed from “neutral” on 28-Jul-2023)
- Trading model: Neutral (Last changed from “bullish” on 23-May-2024)
Update schedule: I generally update model readings on my site on weekends. I am also on X/Twitter at @humblestudent. Subscribers receive real-time alerts of trading model changes, and a hypothetical trading record of those email alerts is shown here.
Subscribers can access the latest signal in real time here.
Time for cheap protection?
Last week, I suggested that the stock market was susceptible to a setback (see A Time For Tactical Caution). Even though the pullback never appeared, I reiterate my cautious view, though I am not outright bearish.
In light of the market’s vulnerable position, it may be time to exploit the low VIX and buy some cheap downside protection in the form of protective put options. The S&P 500 achieved a fresh all-time high while exhibiting a negative 5-week RSI divergence. As well, the VVIX/VIX ratio is showing a negative divergence. Such episodes have tended to resolve bearishly in the past. As well, the VIX Index is low and testing its lower boundary at 12, indicating low option premium and cheap cost of downside protection.
Narrowing breadth
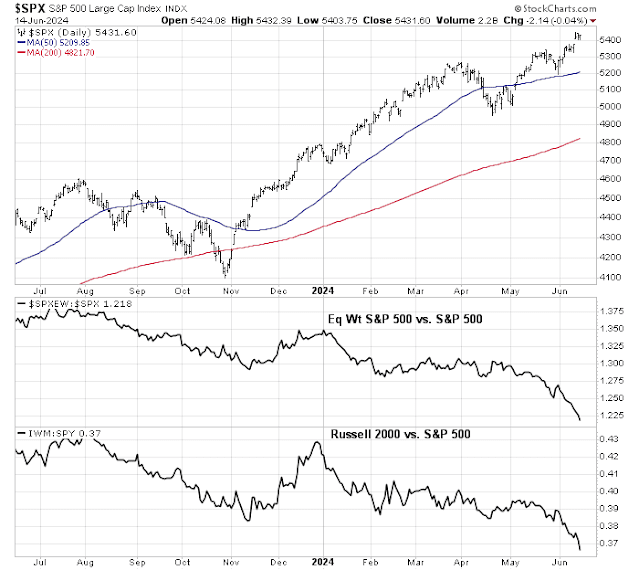
One of my concerns is that breadth has been narrowing instead of broadening as it often does during a bull market. Even as the S&P 500 reached an all-time high, market breadth is narrowing and not broadening out.
To illustrate my point, here is the relative performance of growth sectors. Only technology stocks are showing signs of leadership.
The relative performance of value and cyclical sectors are nosediving.
For completeness, here is the relative performance of defensive sectors, which are all lagging. Even Utilities, which recently gained a bid on the promise of AI data centre demand, rolled over in June.
In other words, only a single sector, technology, is exhibiting signs of market leadership. The other 10 sectors are lagging the S&P 500. The narrow leadership is occurring against a backdrop of a technology sector forward P/E of 30.5, which was last seen in May 2002.
The narrowness of market leadership can also be seen from a market cap viewpoint. Not only is the small cap Russell 2000 underperforming the S&P 500, but also small cap NASDAQ stocks (QQQJ) are exhibiting a similar pattern of underperformance against the NASDAQ 100.
As breadth divergences can last for a considerable time, these conditions aren’t necessarily fatal to the bull run. Instead, it should be interpreted as a signal for caution.
Silver linings
Here is the silver lining in the dark cloud for the bulls. The market’s risk-on tone has been supported by a retreat in Treasury yields across the board that have shown a pattern of support violation.
Already, the usually reliable S&P 500 Intermediate Term Breadth Momentum Oscillator (ITBM) is on the verge of a buy signal setup. The 14-day RSI of ITBM has reached an oversold reading and a buy signal occurs when it recycles from oversold to neutral.
In conclusion, a series of negative breadth divergences is signaling caution for the stock market advance. However, breadth divergence can persist for a long time and these divergences should be regarded as cautionary conditions and not outright sell signals. Investors should take steps to mitigate their long exposure using risk control techniques, such as the use of trailing stops, or take advantage of the low VIX to buy cheap downside put protection.


