A cup and handle breakout
Much has been made about a nascent cup and handle pattern in the S&P 500 and the NASDAQ 100, which would have strong bullish implications if either index were to stage upside breakouts. While investors wait for those breakouts, here is a cup and handle that has staged a definitive upside breakout on both an absolute basis and relative to the S&P 500. It was made by the NYSE FANG+ Index, which represents megacap growth stocks.
In light of the strong price momentum exhibited by the stock market in the wake of the Zweig Breadth Thrust buy signal, I believe these are strong indications that investors and traders should embrace a market melt-up scenario into year-end and possibly beyond.
Learn to love Magnificent Seven
There have been warnings about excessive herding into the Magnificent Seven, or the seven largest megacap growth stocks in the S&P 500.
FT Alphaville highlighted a report by Goldman Sachs that hedge fund concentration in the Magnificent Seven is in the 99th percentile. Instead of fading these stocks, I argue that investors and traders should stay with price momentum and buy the Magnificent Seven as a beta chase into year-end is likely to cause a melt-up in these names for the following reasons.
First, contrary to popular belief, hedge funds are underweight the Magnificent Seven, not overweight. The FT Alphaville article reported that these stocks account for “13 per cent of the aggregate hedge fund long portfolio, twice their weight at the start of 2023”, but went on to acknowledge that this exposure only represents half of the index weight in the Russell 3000. In other words, a fund that bought the S&P 500 index would be overweight the Magnificent Seven when compared to the aggregated bottom-up hedge fund holdings in these stocks.
What overcrowding?
Are you worried about valuation? An analysis of the Magnificent Seven’s forward P/E ratio shows that it’s only roughly at the average for the time frame starting in 2015.
Worried about excessive concentration in the S&P 500? FT Alphaville editor Robin Wigglesworth looked up the 1976 prospectus for the First Index Investment Trust (now Vanguard 500). He found that the top five companies in 1976 “accounted for over 21% of S&P 500, and top 10 were 28.3%. Not far off today’s 23.5% and 32%, respectively.”
Using the NASDAQ 100 as a proxy for megacap growth, the NASDAQ 100 to S&P 500 ratio (black line) is not overly extended by historical standards. Growth stocks have more room to run.
More breadth thrusts
In addition to the Zweig Breadth Thrust that I have documented in past publications, the S&P 500 gained over 9.5% since the October bottom. Call it what you want, a breadth thrust or just strong price momentum. A rose by any other name. Since 1990, there were 15 similar episodes and 11 of them signaled the start of new bull phases.
Jay Kaeppel of SentimenTrader also pointed out that the percentage of major S&P 500 sectors above their 200 dma rose above 30% from below, which is a sector-level breadth thrust. If history is any guide, the market should see strong returns over the next six months.
Supportive macro backdrop
Worried about macro conditions? Don’t be.
Citations of “inflation” during earnings calls have been falling for nearly two years, indicating that inflation is coming under control and confirms market expectations of a rate hike pause.
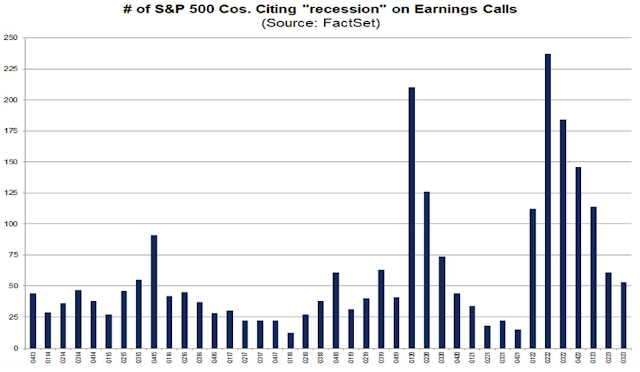
In addition, citations of “recession” on earnings calls topped out six quarters ago and they have been falling sharply.
Supportive sentiment
As well, sentiment readings aren’t overly stretched. The accompanying chart shows the 10 dma of the CBOE put/call ratio and the equity put/call ratio (blue lines) around their 1 standard deviation 200 dma Bollinger Bands. Both indicators are in neutral and neither are showing any signs of excess froth.
The 2019 ZBT template
The V-shaped rebound off the October bottom generated a Zweig Breadth Thrust buy signal in early November. That buy signal is highly reminiscent of the ZBT signal in early 2019, which saw the market also form a V-shaped price surge off the Christmas Eve bottom of 2018.
While history doesn’t repeat itself but rhymes, the 2019 experience could be a useful template for expectations of market performance in the current circumstances. If we use the usually reliable S&P 500 Intermediate Term Breadth Momentum Oscillator (ITBM) as a tactical trading signal, we can see that the S&P 500 ran up for seven weeks and returned 8.5% from the date of the ZBT buy signal until ITBM flashed a trading sell signal when its 14-day RSI recycled from overbought to neutral. The S&P 500 went on to show a total return of 28.8% a year after the ZBT buy signal.
If we were to use the 2019 experience as a guide, the equivalent ITBM sell signal would occur seven weeks after the ZBT buy signal on December 24 and the S&P 500 would reach a level of 4730. As December 24 is in the middle of the seasonally strong period for stock prices, my base-case scenario calls for a tactical rally into early January, followed by a period of consolidation or pullback.
Too early to buy small caps
One concern raised by some technicians is the lack of breadth participation. The equal-weighted S&P 500 and the Russell 2000 are lagging the S&P 500 in the current rally. I don’t believe that should be a significant worry in the short run as the fast money engages in a FOMO beta chase into year-end.
As smaller stocks have lagged in a strong year for the S&P 500, I would expect there would be more losers among these stocks that would be subject to tax-loss selling pressure into year-end. Tactically, nimble traders could rotate from megacap growth to small caps during the second or third week of December in order to take profits in the Magnificent Seven names and position for an anticipated year-end and January small-cap rebound once tax-loss selling season is over.
Buy the dip!
Tactically, the market may be due for a brief pause in the advance. Both the 14-day RSI and the percentage of S&P 500 stocks above their 20 dma are extended, which is likely to resolve in a brief pullback or consolidation. Don’t worry, the S&P 500 continues to rise on a series of “good overbought” 5-day RSI conditions. Any weakness would be a welcome opportunity to buy the dip.
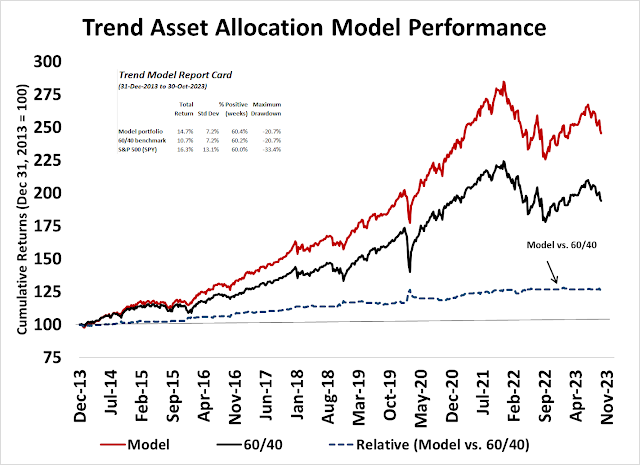
In summary, I would not go as far as to call the current circumstance a generational buying opportunity, but a rare and obvious “fat pitch” that comes along only once or twice per decade. Most of my models have been designed to minimize risk and not maximize return. As an example, my very successful Trend Asset Allocation Model was designed to eliminate significant drawdowns by sidestepping prolonged equity bear markets. The accompanying chart shows the performance of a model portfolio based on a rule varying by 20% in equity weight against a 60/40 benchmark using out-of-sample Trend Model signals.
The current episode of strong breadth thrust off the market bottom in late October is a rare and clear and extraordinary trading signal of a major market bottom. I believe investors should, at a minimum, embrace the likely melt-uTp into year-end and re-evaluate market conditions in January.
My inner investor is bullishly positioned and so is my inner trader. The usual disclaimers apply to my trading positions.
I would like to add a note about the disclosure of my trading account after discussions with some readers. I disclose the direction of my trading exposure to indicate any potential conflicts. I use leveraged ETFs because the account is a tax-deferred account that does not allow margin trading and my degree of exposure is a relatively small percentage of the account. It emphatically does not represent an endorsement that you should follow my use of these products to trade their own account. Leverage ETFs have a known decay problem that don’t make the suitable for anything other than short-term trading. You have to determine and be responsible for your own risk tolerance and pain thresholds. Your own mileage will and should vary.
Disclosure: Long SPXL


All of this to say that Momentum Strategy of winners keep winning is the best strategy. The easy choice to participate is a Momentum ETF. These are overweight the Silver Seven but also own stocks that have weathered the rising interest rate war and investor recession worries. Recession worries will likely grow over the next six months. A Momentum ETF owns stocks proven to be less effected by that narrative.
Finally, a professional portfolio manager MUST show clients a year end portfolio that owns a LOT of large cap winners especially in the A.I. space. There is an old saying in money management that a bubble is what you get fired for not owning. A.I. is still early and will be a bubble but that’s a future worry. But it must show in client accounts now.