Ever since the NYSE Composite monthly MACD flashed a long-term buy signal, I have been monitoring the risks to the bull. Past positive MACD crossovers have signaled long-term resilient equity bull markets and such signals have marked durable advances, which are subject to the normal equity risk of minor corrections without significant bearish episodes.

Part of investing is to be continually skeptical and avoid confirmation bias, which is why I have highlighted possible risks that could derail this bull in the past few weeks. I review these risks here, in addition to others that concern me:
Credit event risk
The July 2023 Senior Loan Officers Opinion Survey on Bank Lending Practices from the Federal Reserve revealed “tighter standards and weaker demand for commercial and industrial (C&I) loans to firms of all sizes over the second quarter” as well as loans in other categories. I was concerned about the rising risk of a disorderly credit event that disrupts markets. Historically, sharp increases in lending standards (blue line) have been correlated with widening credit spreads (red line), which is an indication of risk appetite. More worrisome, the latest weekly data shows that bank credit is continuing to contract.

S&P downgraded a number of regional banks last week. While the KBW Regional Bank Index retreated on the news, the relative performance of the index remains above a key relative support level. In other words, the regional bank stocks bent, but did not break.

Instead, credit spreads have been narrowing. I continue to be concerned about this tail-risk and I am monitoring the situation, but no risks have materialized so far.

The market is signaling a benign credit environment. One key risk in U.S. commercial real estate (CRE) has been diminishing: The relative performance of selected office REITs, which represents the trouble spot in CRE, has bottomed and turned up.

What recession?
Historically, recessions have been bull market killers. While every recession has been associated with equity bear markets, not every bear has been associated with a recession. Street estimates of recession risk have been falling, and the Atlanta Fed’s Q3 GDPNow estimate stands at an astounding 5.9%.
In addition, the Fed’s staff economists have upgraded their forecast from a mild recession in H2 2023 to no recession, according to the minutest of the latest FOMC meeting.
The economic forecast prepared by the staff for the July FOMC meeting was stronger than the June projection. Since the emergence of stress in the banking sector in mid-March, indicators of spending and real activity had come in stronger than anticipated; as a result, the staff no longer judged that the economy would enter a mild recession toward the end of the year. However, the staff continued to expect that real GDP growth in 2024 and 2025 would run below their estimate of potential output growth, leading to a small increase in the unemployment rate relative to its current level.
One of the recession threats I highlighted in my past publication is the softening employment picture. Historically, both temp jobs (blue line) and the quits to layoffs ratio (red line) have led the growth in nonfarm payroll (black line). Temp jobs plateaued in mid-2022 and they have been declining. The quits to layoffs ratio made a double peak in Q4 2021 and Q2 2022, and has been falling in a choppy fashion every since.

The Sahm Rule, as proposed by former Fed economist Claudia Sham, was designed to spot a recession in real time so that lawmakers could respond to the deterioration in economic growth.

New Deal democrat (NDD) found that excess initial jobless claims growth (red line) have led Sahm Rule recession signals (blue line). However, there were enough false positive signals that NDD has demanded eight consecutive weeks of elevated initial claim growth before declaring a recession.

Here is the latest update. The year-over-year growth in 4-week average of initial jobless claims (red line) rose above the key 12.5% recession trigger level for five consecutive weeks but fell back below, which is not enough to call for a recession. I interpret this as a false positive. While U.S. employment is softening, it’s not falling fast enough to trigger a recession.

Could the BoJ crash the market?
I also highlighted the risk of a disorderly global unwind because of a shift in policy from the Bank of Japan (BoJ). The BoJ had been the sole outlier of major central banks when it pursued an ultra-loose monetary policy as its peers were all tightening. Recently, the BoJ signalled a relaxation of its yield curve control policy when it stated it would tolerate a rise in the yield of the 10-year JGB from 50 to 100 basis points. The BoJ added that it reserved the right to intervene should the rise in yields become disorderly.
Japan had been a net provider of liquidity to global markets. One fear is that the shift in BoJ policy would diminish the flow of liquidity, which has the potential to spark a risk-off stampede.
While the 10-year JGB yield (dotted red line) has risen, it did so in lockstep with the 10-year Treasury yield (black line). More importantly, the Japanese Yen has weakened, which would not be consistent with Yen repatriation or even a reduction in liquidity from Japan.

So far, the tail-risk from Japan of a disorderly unwind in risk appetite has not arisen, but I continue to monitor the situation.
China slowdown risk
Finally, I highlighted the risks of China contagion should its economy slow or crash. There have been a number of articles in the popular press about the challenges that China faces (see WSJ: China’s 40-Year Boom Is Over. What Comes Next?, and NY Times: China Is on Edge as Fallout From Its Real Estate Crisis Spreads). Nicholas Lardy of Peterson Institute for International Economics analyzed China’s slowdown and concluded that cyclical fears are overblown.
But a careful reading of the present situation does not support the view that China’s growth is now gripped by a severe cyclical downward spiral that will persist for several years…
In particular:
China’s imports have also weakened, slumping 7.6 percent in the first seven months of 2023, potentially signaling weak domestic demand. But the “decline in nominal import growth was entirely driven by price effects.” In volume terms imports expanded by 1.0 percent compared with a decline of 6.4 percent in the same period last year. Thus, imports in the first half of 2023 are signaling increasing domestic demand.
Lardy’s analysis went on to address and debunk fears that households have lost confidence in the economy, the slowdown is depressing wages, China deflation fears and slumping private investment.
In any case, I demonstrated that the relative performance of the S&P to MSCI All-Country World Index (ACWI) 500 is negatively correlated to the relative performance of MSCI China (bottom panel). In other words, U.S. equity markets are largely insulated from China.

What keeps me awake at night
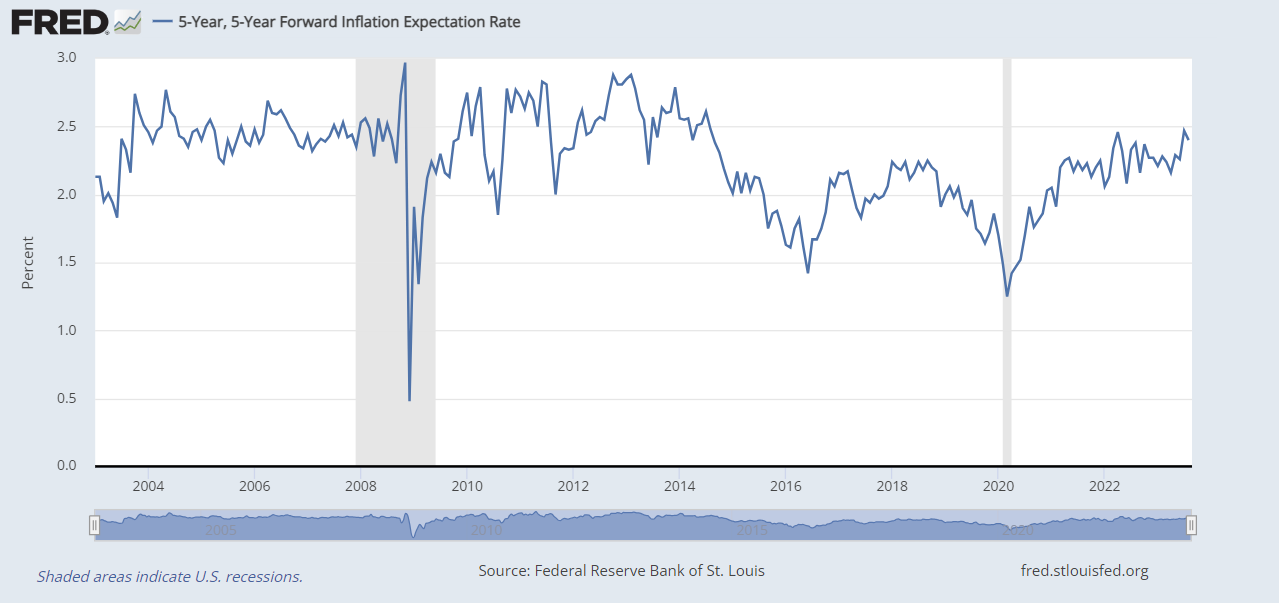
I conclude from my review that none of the risks we highlighted have materialized, though we continue to monitor them. However, the one key risk that keeps me awake at night is rising inflation and the possibility of upward pressure on interest rates. Even though inflation rates have come down, inflation expectations have been edging up, which is likely to make the Fed uncomfortable.
The 2-year Treasury yield can be thought of as a proxy for market expectations in changes in the Fed Funds rate. Past peaks in the 2-year yield have either been coincidental or led peaks in Fed Funds. With the 2-year at over 5%, it is showing no signs of a major peak. With the S&P 500 trading at a forward P/E of 18.7, upward pressure on interest rates will put pressure on equity valuations and could put a ceiling on potential stock market gains.

In conclusion, the market faces a number of key macro risks that I continue to monitor, but those risks have not materialized to threaten equity markets. However, the threat of rising rates could put pressure on equity valuations and put a ceiling on any potential stock market gains.
Citi Bank (C) one of the larger major center banks made 13 days of new lows and is now trading at levels when we had the SVB Bank fiasco in March. Charles Schwab (SCHW) and Goldman Sachs (GS) charts do not look very healthy either. High interest rates are causing very high unrealized losses to their bond portfolio.
Add this to the list of Cam’s concerns.
Perhaps it is because we cannot really wrap our minds around trillions of $ of stimulus and PPP.
That money doesn’t end up being burned in the backyard, it goes somewhere. This money was sent out into the general circulation, it’s not like QE which just affected bank reserves.
How long does it take for malinvestments etc to burn through trillions?
Rates have gone up but banks are lending less…could it be that potential borrowers stocked up on cheap loans back during the pandemic? Naturally banks charge more also since rates have gone up. But who in their right minds is doing a refi on their sub 3% 30 year mortgages. Not many (my neighbor does refis and he still gets the rare request )
So maybe we need more time for these trillions to dissipate and for conditions to truly tighten.
Whether the market goes up or down, to be honest, I just want to be on the right side of it. Selfish huh?
Looking at a 20 year chart of C, it is grinding slowly higher with higher highs and lows after it’s dreadful face plant of 2008…gone are the glory days though.
Here is a great article on a key reason markets are surprising on the upside.
US Budget Deficits Are Exploding Like Never Before:
https://www.bloomberg.com/news/articles/2023-08-24/bond-market-flashes-warning-as-us-budget-deficit-surges
I just finished Richard Koo’s new book. His theory of the Balance Sheet Recession is brilliant. I strongly suggest watching a Youtube video where he describes it. He says that when companies and individuals as a group reduce their borrowings, the government must borrow and spend the shortfall or the economy will fall into recession. No amount of lower interest rates or Central Bank liquidity will induce borrowing by the public when they are reducing debt.
So American bank borrowing is approaching zero growth or slightly below BUT government borrowing and deficit spending is historically enormous which keeps the economy rising. Their government borrow and spending doesn’t offset lower corporate/individual borrowing/spending, it substantially INCREASES it. All of the previously reliable macro recession indicators related to Fed policy and interest rates (yield curve etc.) don’t work when deficits run so hot. BTW, high deficits are baked in until after the Presidential Election. Afterwards, fasten your seatbelts.
China is a different story. Public borrowing is down but the government is NOT offsetting it with deficit spending. The lower rates there and reduction in bank reserve requirements is NOT stimulating the economy as Koo’s theory predicted, so markets fall. They are in a Balance Sheet Recession until the government decides to borrow massively and spend.
Europe has a problem in as much as Euro budget rules restrict government deficits. They seem to be heading into a downward economic Balance Sheet Recession spiral.
This also means the US economy will be strongest in the G7 with their currency also strong. It means US interest rates ‘higher for longer.’ It means the stock markets mysteriously stay stronger that past macro indicators would predict.
BTW the U.S. OECD Leading Economic Indicator just turned up after a long decline. Sentimentrader.com did a full article on how this has led to predictably strong stock markets.
That sounds like what I said a while back about gov’t fiscal spending deficits going into the general circulation. With a sovereign debt crisis and aging demographics fiscal deficits will likely continue to balloon, which will put more money into circulation. It doesn’t really matter if it’s called stimulus checks, or social security payments or PPP, it’s money going into circulation.
What’s next? My bet is that when the debt burden gets too heavy from an interest perspective that we get yield curve control, like Japan. So sovereign debt gets a low yield and the rest of us it depends on the market and what spread it charges.
American Century Investments currently estimates the odds of a recession at 60%, stagflation at 30% and a Goldilocks outcome at 10%. Fidelity’s view is of a late cycle economic environment. The implication being that there will be an economic slowdown at a minimum. Fed is determined to bring inflation to 2% and will likely stay higher for longer.
MACD measures what has happened. The outlook is highly uncertain with all the factors outlined above. Stay defensive and diversified.
Enjoyed reading all the postings here today. Worries are good for the markets. That said we should expect market behavior to deviate more and more from the past. And one factor will be even more prominent in the future: concentration. I used to like 80/20 Pareto Rule. Now I am going to go further with 90/10. Read an article somewhere on the Internet where the author maintained that 90% of everything is junk. A bit extreme but I have since run quite a few data sets in various fields. It is indeed getting more concentrated in many measurables. 80/20 has been more or less adequate for a long time. But the it is getting narrower and accelerating.
One thing is still true: Price leads fundamentals. Another thing will always be true: Only price pays.