Short-term bearish
Here are some reasons why traders should be short-term cautious about the stock market. Bloomberg reported that stock vs. bond sentiment is at a record high, which is contrarian bearish for stocks.
Stock-bond sentiment
A downside break?
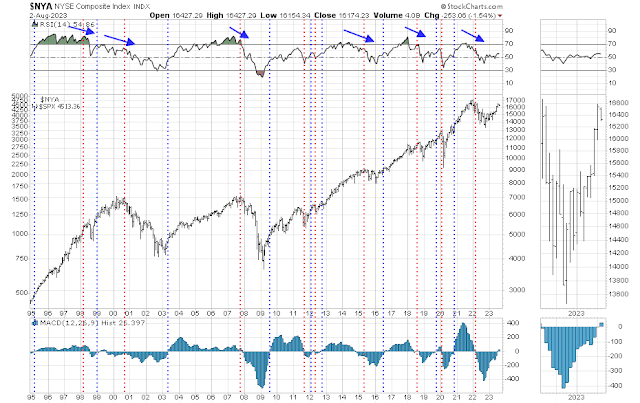
The S&P 500 has been advancing while exhibiting a series of negative RSI divergences. This is a risky condition and a downside break is bound to happen sooner or later. Initial support can be found at about the rapidly rising 50 dma, which is in the 4400-4450 zone. If initial support fails, strong support can be found at about 4200. That said, today’s stock market downdraft spiked the VIX Index above its upper Bollinger Band, which is a sign of an oversold condition.
My inner investor is opportunistically accumulating stocks in order reach an overweight position in equities. My inner trader is short the S&P 500. The usual disclaimers apply to my trading positions.
I would like to add a note about the disclosure of my trading account after discussions with some readers. I disclose the direction of my trading exposure to indicate any potential conflicts. I use leveraged ETFs because the account is a tax-deferred account that does not allow margin trading and my degree of exposure is a relatively small percentage of the account. It emphatically does not represent an endorsement that you should follow my use of these products to trade their own account. Leverage ETFs have a known decay problem that don’t make the suitable for anything other than short-term trading. You have to determine and be responsible for your own risk tolerance and pain thresholds. Your own mileage will and should vary.


My inner investor is opportunistically accumulating stocks in order reach an overweight position in equities. My inner trader is short the S&P 500.
Kind of confusing Cam? Sounds like you are training for the hedge fund business! (LOL) Seriously, I get the strategy, but if you are shorting the index, could you be a little more specific on the sector, factor, or industry group you are accumulating?
Thank you for your time
Buy on weakness.
1987 is a good analogy to this year. It was a pre-Presidential Election year (1988 George Bush) when the stock market was up over 30% mid-year while the Fed was raising interest rates a lot. August was the top and the final Crash was in October. The year was up only 3% when the dust settled.
Octobers in pre-election years are points of correction lows historically.
I think similarly, we could have a correction, not a crash, into September/October followed by new highs going into 2024.
I’m a simple man. When Ken leads with 1987 I listen.
Only it’s 1987…the debt is way different, In 1987 rates had been going down for years, now they are going up. The P/Es back in 1987 were not as high, we still had the fall of the Soviet Union to act as a tailwind, along with more falling rates. Now if rates go down, it’s because we have a big problem. So if rates stay at this level it’s gonna start hurting people. Student loans payment restarts, and nobody mentions PHE ending where millions of people no longer qualify for Medicaid, this won’t help.
One thing about charts that is misleading is that if price keeps going up for some deep underlying reason so that it keeps going up….well you get a really high RSI that stays up, and things keep going up because of whatever that reason is. So it is one of those association is not causation things. Causation is more along the lines of fundamentals, association is chart patterns.
Yes I have a very hard time believing what the market is doing, but in the short run, it is all about prices.