Preface: Explaining our market timing models
We maintain several market timing models, each with differing time horizons. The “Ultimate Market Timing Model” is a long-term market timing model based on the research outlined in our post, Building the ultimate market timing model. This model tends to generate only a handful of signals each decade.
The Trend Asset Allocation Model is an asset allocation model which applies trend following principles based on the inputs of global stock and commodity price. This model has a shorter time horizon and tends to turn over about 4-6 times a year. In essence, it seeks to answer the question, “Is the trend in the global economy expansion (bullish) or contraction (bearish)?”
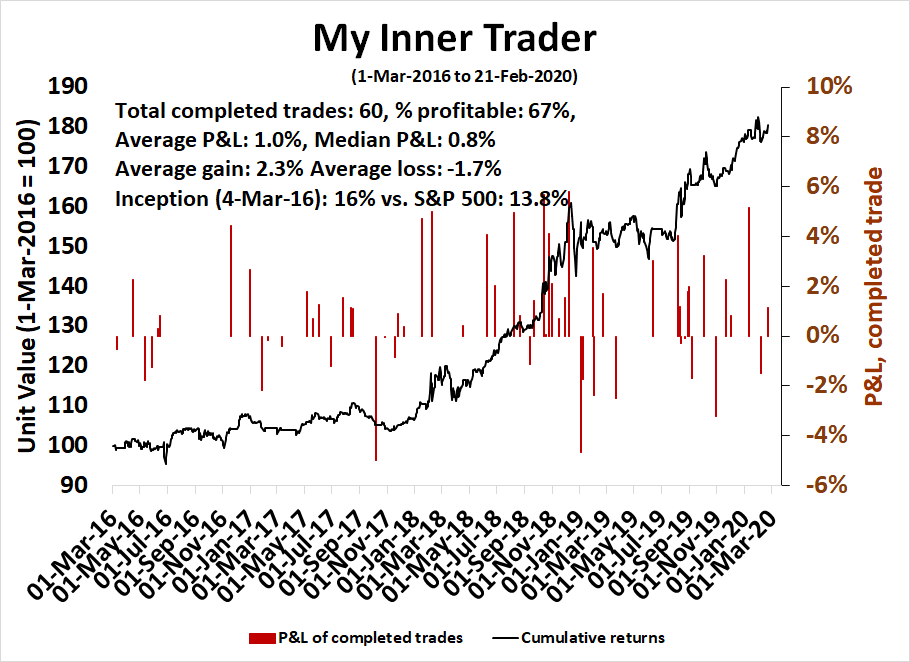
My inner trader uses a trading model, which is a blend of price momentum (is the Trend Model becoming more bullish, or bearish?) and overbought/oversold extremes (don’t buy if the trend is overbought, and vice versa). Subscribers receive real-time alerts of model changes, and a hypothetical trading record of the those email alerts are updated weekly here. The hypothetical trading record of the trading model of the real-time alerts that began in March 2016 is shown below.
The latest signals of each model are as follows:
- Ultimate market timing model: Buy equities
- Trend Model signal: Neutral
- Trading model: Bearish
Update schedule: I generally update model readings on my site on weekends and tweet mid-week observations at @humblestudent. Subscribers receive real-time alerts of trading model changes, and a hypothetical trading record of the those email alerts is shown here.
A downside break?
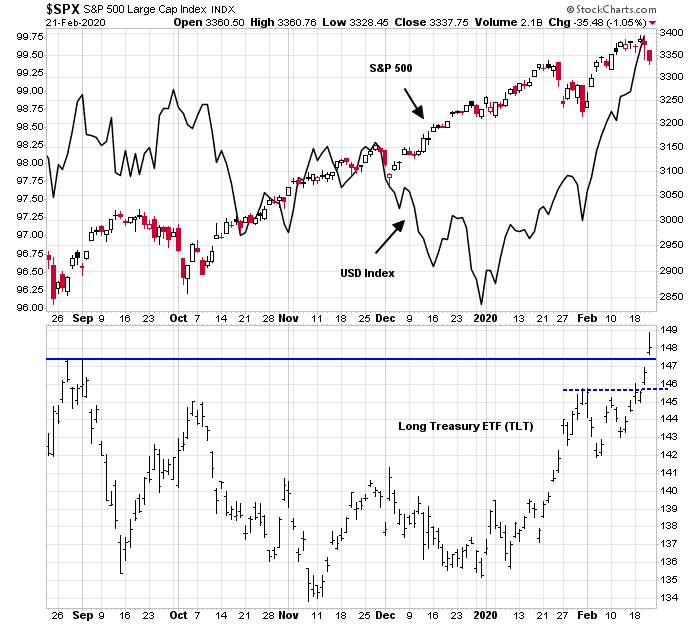
Is this the start of a correction? I made the point in the past (see Why the market is rallying on fear – Yes, Fear!) that USD assets were rising because foreigners were piling in because the US is the last safe haven. That was why US equities, bonds, and the USD were rising in concert. The equity market began to decouple late last week from bond prices, which are the possible signs of a downside break, but the conclusion is not definitive.
A crowded long
Sentiment models are pointing to a crowded long position, which makes the market ripe for a sudden downdraft. Both institutions and fast money have been pouring money in stocks. The latest BAML Global Fund Manager Survey shows equity sentiment at a 20 month high…
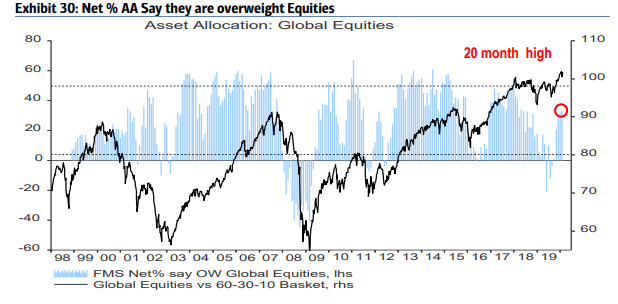
…and the US is their favorite regional allocation.

Evidence is gathering that the fast money is all-in on the bull side. Data from Goldman Sachs Prime Brokerage shows that long/short fund positioning and leverage are off the charts.

Long/short hedge funds are not the only participants in the fast money space. An estimate of systematic hedge fund traders indicate that the potential payoffs are asymmetric for a bullish and bearish move. The systematic traders are nearly full up on their equity long positions, and while they retain some buying power should the market move up, the downside price potential on market weakness is much higher. Should prices fall, we could see a cascade of model-induced selling that becomes self-reinforcing.

Consequently, current market psychology then makes the latest cover of the Economist is a setup for a textbook contrarian magazine cover warning for the bulls.

As well, the Citigroup Panic/Euphoria Model is firmly in euphoric territory.

Cross-asset signals
Signals from cross-asset analysis are leaning mostly equity bearish. The 3m10y yield curve has inverted, which is sure to spook some traders. While the other parts of the yield curve have not inverted, they are flattening, which lends credence to the idea of a slowing economy with equity bearish implications.

The 30-year Treasury yield fell to an all-time low last week. Point and figure charting, based on a 2-box reversal, sets the downside target at 1.73%, which is roughly 20bp below current levels. (A 3-box reversal yielded a rather unrealistic target of 0.6%.)

The bond price bullish and yield bearish view is supported by the Commitment of Traders Report of positioning from Hedgopia. The report shows that large speculators are net short the T-Bond futures. By this metric, sentiment is not stretched for the Treasury market.

Similarly, large speculators are also net short the 10-year T-Note.

Other signals from the credit markets, namely the relative price performance of HY and EM bonds relative to their duration-equivalent Treasury benchmarks, are also flashing negative divergences with equity prices.

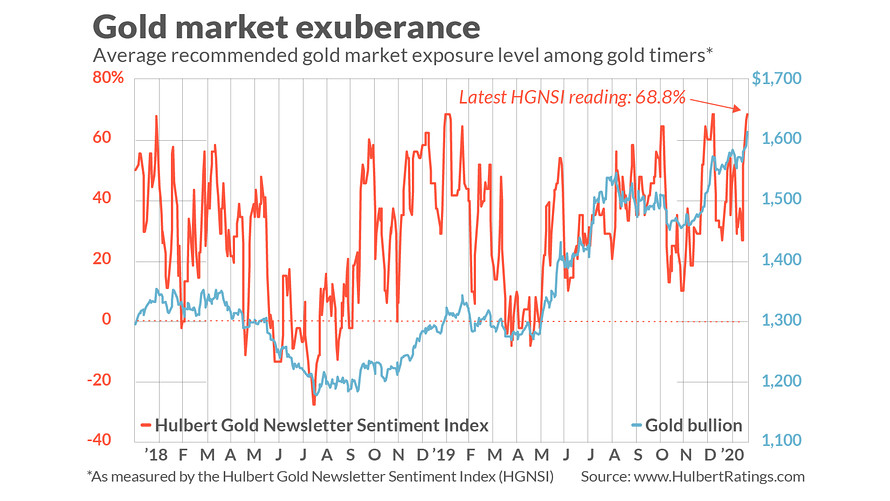
Gold prices, which usually move in the opposite direction as stocks, have staged an upside breakout indicating rising fear.

However, Mark Hulbert pointed out that his Hulbert Gold Newsletter Sentiment Index is at a crowded long reading. This may be a signal of peak fear which could put a floor on equity prices.
The COT report for gold futures also shows that large speculators are in a crowded long position.

Silver linings
For the bulls looking for a silver lining in a dark cloud, the case for a correction is not definitive from a factor perspective. On one hand, the high beta to low volatility factor ratio is starting to roll over, which has signaled falling equity risk appetite and market weakness. On the other hand, the price momentum factor is still holding up, indicating that equity risk appetite has not fully diminished.

As well, Q4 earnings season is coming in slightly above expectations. In particular, the sales beat rate is well above average, and forward 12-month EPS is still rising.

Another silver lining can be found in the price action of the transportation stocks, which were devastated by the covid-19 induced slowdown. The DJ Transports has held support, and it is rallying above a relative support break (see bottom panel). In addition, the DJIA uptrend remains intact.

The week ahead
Looking to the week ahead, the market may see a potential bounce early in the week. The S&P 500 is testing support at the January high breakout level of about 3335. However, the index is not oversold on either the 5 or 14 day RSIs, nor is the VIX Index above its upper Bollinger Band, which is another oversold market indicator.

Similarly, short-term breadth indicators are only in neutral territory and not oversold. If momentum continues to turn south, there is more short-term downside potential.

Looking out over an intermediate term time horizon, the Fear and Greed Index closed Friday at 43, which is considered to be neutral, and does not reflect extreme fear. We would wait for a sub-20 reading before declaring a necessary condition for a bottom.

My inner investor is neutrally positioned at about the portfolio weights specified by investment policy. Until there is greater clarity on the effects of the covid-19 coronavirus outbreak, it is virtually impossible to assess risk and reward.
My inner trader took profits on his long positions last week and swung short.
Disclosure: Long SPXU
https://www.yahoo.com/news/china-canceled-central-event-political-085543052.html
Optics is more important to China than ever before. That said, it is no different for any other Western country including the US of A. The difference is, in China, one party stands to lose the most. In the US (and west) there are two parties, but members of both parties fool the public and live off the the leverage. No apologies for speaking the truth. Whatever happened to the Tea Party in the US. Sorry, it is not my intent to politicize this post.