In my discussions with investors, the Cyclically Adjusted P/E (CAPE), or Shiller P/E, has come up numerous times as a risk for the U.S. stock market. The current reading of 32x is only exceeded by the peak during the NASDAQ Bubble, and it is higher than the levels seen before the Crash of 1929. Does this mean that the risk of a substantial stock market drawdown in the near future is rising?
I studied the question in the context of some of the criticisms of the Shiller P/E and made a number of adjustments to the calculation. I found that the answer is the same. The U.S. equity market is expensive, but Shiller P/E does not work well as a short-term market timing technique. However, I have found that the combination of valuation and price momentum can provide clear warning signs that the market is about to enter a bear market.
Adjusting Shiller P/E for the Great Financial Crisis
The Shiller P/E uses the average 10-year real earnings as one of its inputs. One of the points made in our investor discussions is the effects of the Great Financial Crisis of 2008–2009 (GFC) will be fading soon from the calculations. Once those depressed earnings drop off the 10-year trailing window, the ratio should decline, which makes valuation much cheaper.
The adjustment for the GFC depends on the timing of recessions during Robert Shiller’s study period, and current conditions today. The chart below shows that the current equity bull market, which began in March 2009, is well above average. Past profit and economic cycles were shorter, and therefore Shiller P/E calculations would have tended to include at least one recession during its 10-year lookback period.
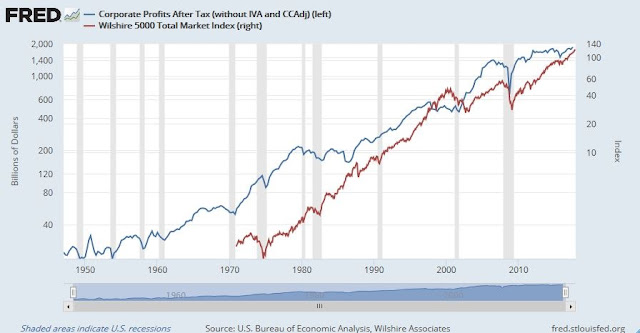
For another perspective, following chart shows history of NIPA corporate profits, which historically have been correlated with equity market profits (see BEA study), and the Wiltshire 5000 as a frame of reference for equity returns. As the chart shows, the frequency of recessions was early in the post-WW II period and past Shiller P/E calculations would have tended to include recessionary periods where earnings contracted in its 10-year lookback periods.
Should the current economic cycle continue into 2019 without a recession, then arguably the effect of dropping off the recessionary earnings of the GFC actually artificially elevates Shiller P/E, rather than act to make the market less expensive.
Another way of addressing the 10-year GFC recession problem is to extend the lookback period. DQYDJ has such a facility. Extending the lookback period to 20 years shows that valuations are similarly elevated.
Adjusting Shiller P/E for macroeconomic conditions
A researcher at the San Francisco Fed recently proposed a novel way of adjusting the Shiller P/E for the effects of changes in r* and other macroeconomic inputs (see link to paper). To explain, r-star (r*) is what economists use to describe the long-term expectation for the real rate. Even though it is not observable, a useful proxy is long-term forecasts for Fed funds, adjusted for the Fed’s inflation target, found in the Fed’s dot-plot.
In the latest dot-plot, the median Fed forecast now stands at 2.75%. Assuming it reaches its inflation target (2%) that would put the real rate at 0.75%.
Kevin Lansing of the San Francisco Fed found that changes in CAPE was highly correlated to changes in r-star:
Figure 3 shows that shorter-run movements in r-star generally go in the same direction as the CAPE ratio. The correlation between the two series is strongly positive. This pattern is consistent with the idea that upward movements in r-star tend to be observed during booms or recoveries, which are periods of lower macroeconomic uncertainty (Lansing 2017). Lower uncertainty stimulates investors’ demand for risky assets like stocks, contributing to a rise in the CAPE ratio. Likewise, downward movements in r-star tend to be observed during recessions or crises, which are periods of higher uncertainty. Higher uncertainty stimulates investors’ demand for safe assets like U.S. Treasury securities while stock prices tend to fall, contributing to a decline in the CAPE ratio. Using the projected path for r-star from Figure 1, the projected path for the 20-quarter change in r-star shows a continued increase for a time, followed by a reversal as r-star levels off at 1%.
These results may initially appear to be counterintuitive. Why should the Shiller P/E rise as r* rises? This effect can be explained by changes in expectations. During the late phase of an expansion, stock prices can rise even as the Fed raises interest rates. That’s because positive effects of expected higher earnings growth overwhelms the negative effects of higher interest rates, which results in P/E expansion. The same effect is observable when Shiller P/E and r* rise together.
Lansing went on to fit a projected CAPE ratio into the future using a series of macroeconomic variables, namely the Laubach-Williams (LW) two-sided estimate of r-star, the CBO four-quarter growth rate of potential GDP, the 20-quarter change in the LW r-star estimate and the four-quarter core PCE inflation rate.
He concluded:
Over the long history of the stock market, extreme run-ups in the CAPE ratio have signaled that stocks may be overvalued. A simple regression model that employs a parsimonious set of macroeconomic explanatory variables can account for most of the run-up in the CAPE ratio since 2009, offering some justification for its current elevated level. The same model predicts a 13% decline in the CAPE ratio over the next 10 years. This prediction, if realized, would imply lower returns on stocks relative to those enjoyed in recent years when the CAPE ratio was rising.
In effect, investors can expect no help on expected equity returns after macroeconomic adjustments.
High Shiller P/E = Low LT returns
Having established that the Shiller P/E is elevated, what does that mean for investors? The experience of the last 10–20 years has shown that a high Shiller P/E is not necessarily a danger signal for equity prices. Stocks have continued to rise even in the face of above-average CAPE. Simply put, CAPE is ineffective as an intermediate-term market timing model, though it can be a useful tool to forecast long-term returns.
Michael Lebowitz at 720Global projected 10-year U.S. equity returns under a variety of scenarios using the combination of earnings growth, starting and ending Shiller P/E and 10-year Treasury yields. His base-case scenario called for Shiller P/E to fall from the current elevated levels to one standard deviation above its long-term average in 10 years. Expected U.S. equity returns came in at 2.7%, which is barely above the yield of the 10-year Treasury note.
In other words, U.S. equities will be nothing to write home about.
A better way to market time with Shiller P/E
CAPE is not known for being a market timing tool, as high Shiller P/E ratios have not historically been followed by bearish markets. There may be a better way, which I wrote about before.
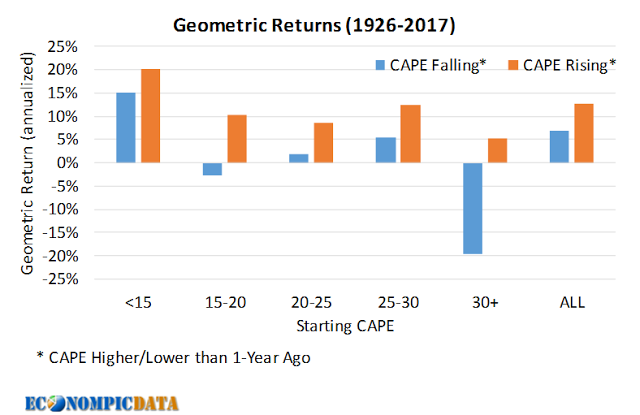
The blogger Econompic found that adding price momentum to CAPE valuation can be an effective way to time the market. He found that equity prices are at the greatest risk of a major decline when CAPE is above 30 (32x today), and CAPE is falling.
This study makes market timing with Shiller P/E simple. As long as CAPE is rising, as evidenced by rising prices that raise the ratio, bear market risk is low, but get out of the way when the market starts to decline.
Investors should bear this rule in mind in the current environment where Shiller P/E stands at an elevated reading of 32x.


This was a very excellent post. Thanks
In depth analysis you can’t get from any other source.
I still struggle, as an investor, with how much to pull out and sell because the tax burden is so stiff. And if you sell off a bit every year, you miss the bull. Is there a formula for this.
Tax optimization is highly specific to the individual and I am not qualified to comment on your account because of the customization involved.
If you don`t want to sell, but you would like to protect profits, one strategy you could consider is the use of option collars, where you sell a call and buy a put against your position. Even those kinds of strategies are also highly individualized and you need someone who knows your circumstances to advise you.