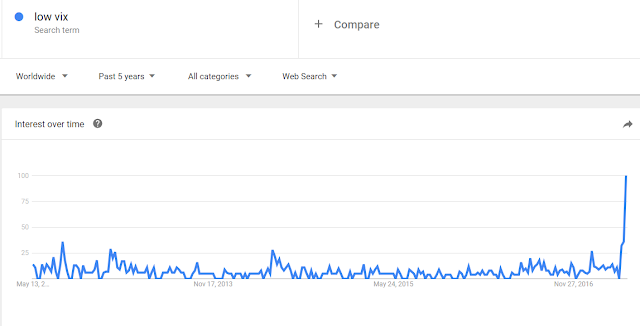
Investor angst has been rising over the low level of the VIX Index. A simple glance at Google Trends tells the story of rising anxiety.
The VIX Index fell to single digits last week, though it recovered to above 10 by the end of the week. Nevertheless, current levels represent multi-year lows.
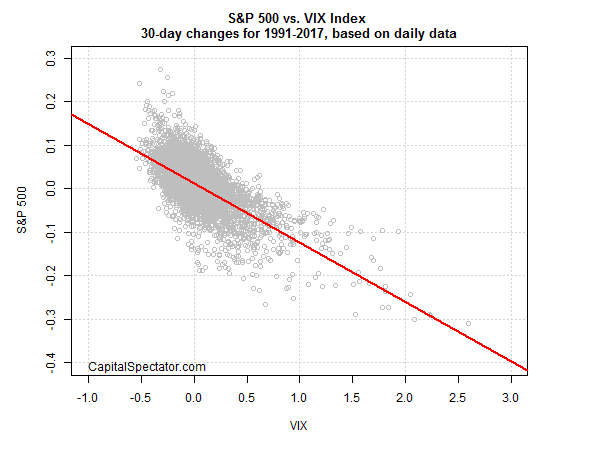
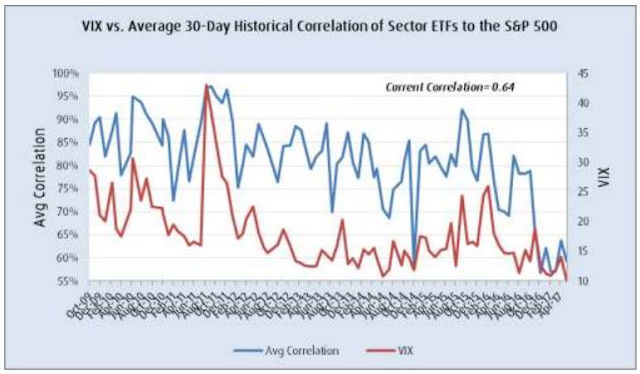
James Picerno at Capital Speculator demonstrated in the chart below that changes in the VIX are inversely correlated with stock prices. The combination of a low VIX and the inverse correlation has a lot of people questioning if a VIX spike could spark a rapid or disorderly equity market sell-off.
The doomsters should calm down and stop reading Zero Hedge. There are several good reasons for the low level of the VIX Index:
- Realized equity volatility is low
- Other asset class volatility are low
- Cross-asset correlations are low, which means that sectors and asset classes are more diversifying, and therefore depresses realized volatility
In that case, why shouldn’t the VIX, which is anticipated volatility, be low? To be sure, a low vol regime does carry its own risks. When vol does spike, it will catch a lot of investors and traders by surprise and has the potential to cause a lot of damage to asset prices.
Look Ma, no vol!
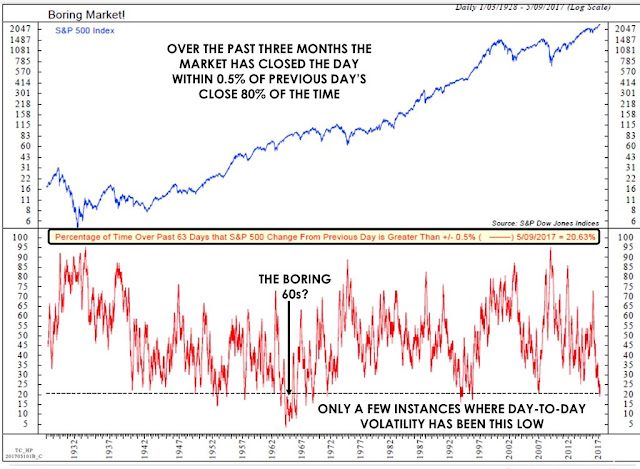
In the current low VIX environment, investors need to look beyond the simple low level of the VIX Index and recognize the historically low level of realized equity volatility in the market. There have only been a handful of instances where realized vol has been this low.
Renaissance Macro recently pointed out that equity vol is low because of low economic volatility.
Low vol isn’t just restricted to equities. Bloomberg observed that bond vol has also fallen off a cliff.
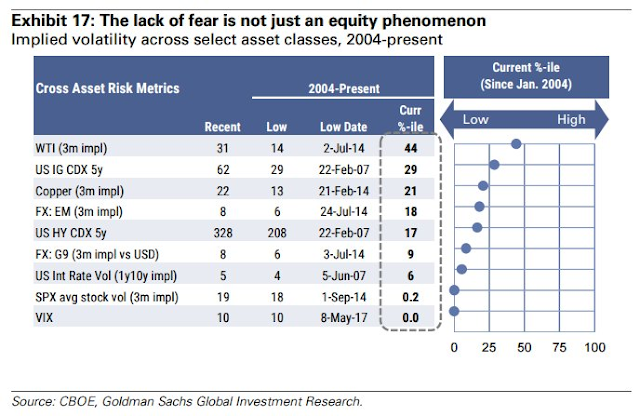
Similarly, vol on other asset classes are also depressed.
Greater diversification effect
Part of the reason for the low vol environment is the higher diversification effect of low asset class correlations. Marketwatch highlighted analysis from Nick Colas of Convergex showing the low levels of correlations between different equity sectors. Low correlations mean that when one sector is rising, another is falling, which is diversifying. At the same time, these diversification effects serve to lower overall equity volatility.
Morgan Stanley also observed a similar level of low correlation between asset classes, which also lowers overall volatility.
Vol regime clustering
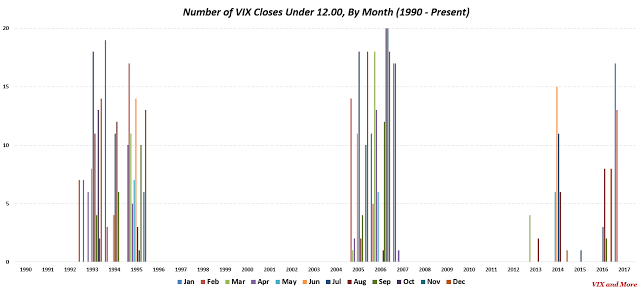
Should investors and traders be worried about the low VIX? Not necessarily. Bill Luby, who is the master of vol analysis at VIX and More, showed that low and high volatility regimes tend to cluster together:
I thought I could use this space to expand upon some of the points I made. Specifically related to the clustering of low volatility, the graphic below shows that when the VIX closes below 12, it tends to persist in these low readings, clustering for several years, before remaining above 12 for even longer periods during high volatility regimes.
A corollary to the above is that while investors often focus a good deal of their VIX analysis on mean reversion, it is important to note that mean reversion is much more predictable and tradeable following a VIX spike than after a significant decline in the VIX.
What about the short VIX position?
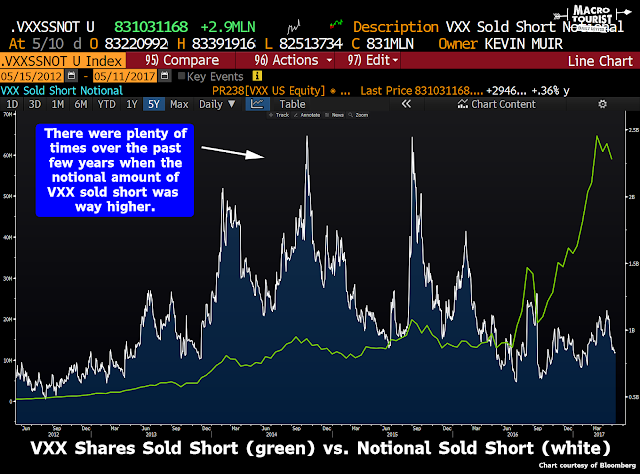
At this point, some traders will point to the enormous short position in VXX? Kevin Muir at The Macro Tourist demonstrated that the VXX nightmare is not something to really worry about. As the chart below shows, while the number of VXX shares sold short (green line) has skyrocketed, the notional value (white line) is not that elevated by historical standards.
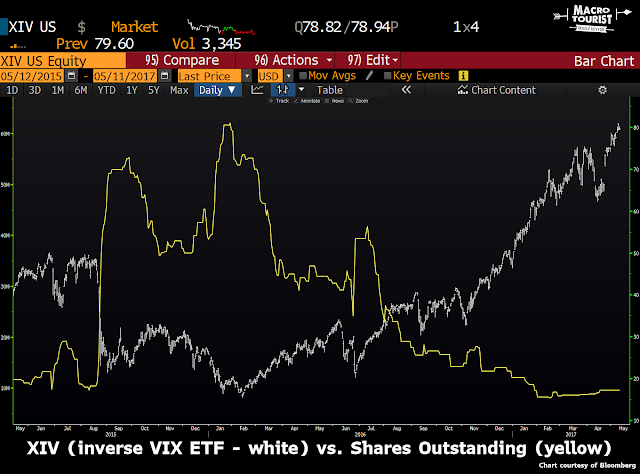
If the Street was really betting on a rising VIX, Muir then asked, “Why isn’t the shares outstanding in XIV rising instead of falling?
He went on to conclude that the Street is actually short VIX, not long VIX:
I am aware that these ETF products represent only one portion of the VIX trade. There are futures on VIX, and even more complicated institutional products, like variance swaps. Maybe there is a monster short volatility position out there at the OTC level that I am unaware of. I am not ruling it out.
But I am suggesting that the short term hot money is long VIX, not the other way round. All you need to do is look at the amount of complaining occurring about the lack of volatility. If there really was this massive speculative short vol position, wouldn’t traders be whooping it up? Instead, all I hear is moaning about the collapsing VIX.
The roots of a market demise
Let’s review what we know so far. The VIX Index is low because realized vol is low, not just equities, but all asset classes. Low vol has been exacerbated by the diversification effects of low asset correlations, both within asset classes and across asset classes. As vol regimes tend to cluster together, the market is simply undergoing a low vol regime.
However, these cluster effects contain the roots of a market demise.
In particular, focus on the low return correlations within and across asset classes. Bloomberg recently featured a story, A Warning That the Biggest Risk for Markets Could Be Too Much Harmony, that could be a warning for investors. Risk-parity funds could play the role of portfolio insurance strategies in the Crash of 1987, namely the mechanism that exacerbated downside volatility in a disorderly market retreat:
Briefly: risk-parity funds operate simultaneously in a bunch of different asset classes, weighting their stakes in each according to volatility. If one category of holdings swings around a lot, like stocks, it gets a smaller slice, while quieter bonds get a bigger one. Diversification like this is supposed to balance influences…
Turns out, a bigger threat than volatility to the strategy is cross-asset correlation, the possibility that assets like stocks and bonds start to move in unison. When that happens, diversification-minded risk parity algorithms will sense a threat and start to deleverage, says Brean Capital LLC’s Peter Tchir. Markets may be charting healthily independent courses for now. But if and when that changes, look out, his theory holds.
“The biggest risk, as I see it, isn’t that volatility increases – it is that the correlation between Treasuries and stocks increases (they move in the same direction),” wrote Tchir in a note to clients Wednesday. “That shift would have the largest impact on returns and need to reduce position size for these strategies.”
These dire forecasts of risk-parity funds becoming forced sellers in a market melt-down are somewhat overblown. As investors saw during the Lehman Crisis, return correlations all converged to 1 during a crisis, and risk-parity funds would have to adjust their positions accordingly. At the same time, these funds do not use short-term correlations to set their asset allocations, largely because of cross correlations are, well, volatile:
“Because our forecasts for correlation move much more slowly than for volatility, the rate at which changes in these things show up in the portfolio is radically different,” said Croce. “If the market is more volatile for several days, we may sell some of our exposure. But if correlations rise, it will have almost zero short term implications for our holdings.”
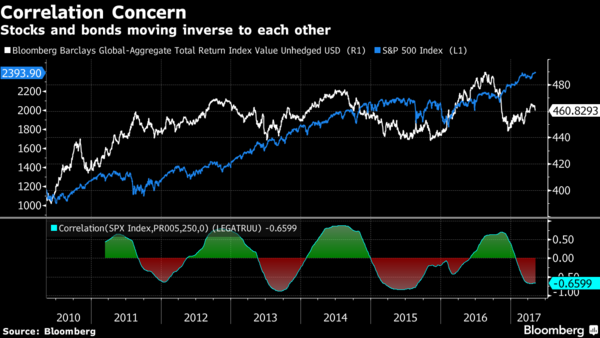
A risk parity fund might use a year-long measure for correlation, since shorter-term indicators are noisy and impossible to act on, said Croce. The correlation between the price of the Bloomberg Barclays Global Aggregate Bond Index and the S+P 500 over the past 250 days is negative 0.66, a moderately strong inverse correlation, and the most negative in nearly two years.
Should the negative relationship between stocks and bonds begin to wear off and their correlation rise to as little as 0.1, a hypothetical risk parity portfolio of just those two assets would cut its leverage by 87 percent, according to Salient estimates. That compares to a 120 percent reduction should volatility measures double.
Much of the risk therefore depends on the nature of the vol regime shift. A quick regime shift, such as a flash crash, would not trigger very much action by risk-parity funds. However, a long-lived shift, such as a change from an easy monetary policy to a more normalized environment by the Fed and the ECB (see my last post How the bull will die), could result in forced liquidity by these funds.
How I learned to stop worrying…
In conclusion, the low level of the VIX is nothing to worry about right now. But should the macro environment change significantly, then there is potential for a meaningful regime shift from low vol to high vol. If such a scenario were to unfold, downside volatility could be exacerbated by forced selling by risk-parity funds.



In its roughly five and a half years of existence SVXY has had a daily loss of 5% or more 115 times, or about 20 times a year on average. However, it has not experienced a 5% loss since early November, about a half year ago. While the day is still young it looks likely to end that streak today.