Mid-week market update: Increasingly, I have seen cases being made for an equity market correction. This Bloomberg article, “Five charts that say not all is well in the markets” summarizes the bear case well.
- Uncertainty is at a record high: The number of news stories using the word “uncertainty” is surging.
- Wall Street vs. Washington: While the Global Economic Uncertainty Index is elevated, the VIX Index remains low by historical standards.
- The price of hedging tail-risk is rising: Even as the VIX remains low, the CBOE SKEW Index, which measures the price of hedging extreme events, is high. Which is right?
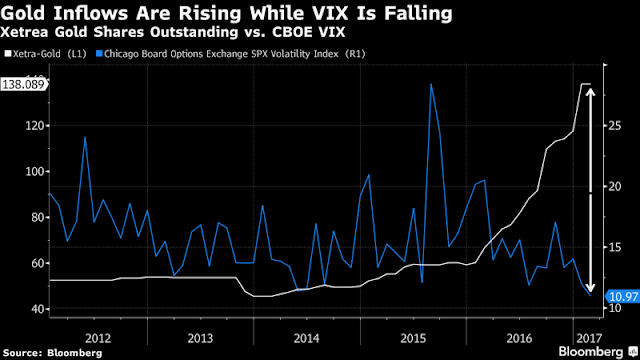
- Gold is rising: Gold is often thought of as a safe haven in times of stress and the gold price has recently been inversely correlated with equity prices.
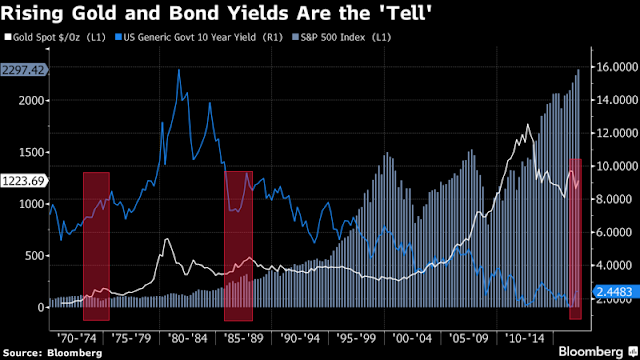
- Watch for gold and bond yields to rising together: “Gold may prove the “tell,” according to Chris Flanagan, also at Bank of America. He advises investors to watch “for the combo of rising yields and rising gold prices to signal impending market volatility.” Three consecutive quarters of rising benchmark bond yields and gold prices preceded previous market falls including the 1973-1974 bond market crash and Black Monday in 1987, he says. The yield on the benchmark 10-year U.S. Treasury has risen to 2.44 percent from 1.77 percent since Trump’s election win. Gold has moved sideways.”
Much of the anxiety can be summarized as, “What’s wrong with the low level of the VIX Index? Isn’t the VIX supposed to be a fear gauge?”
Why aren’t stock prices falling if actual fear is so high?
The VIX explained
To answer those questions, let’s start with the definition of the VIX Index. The VIX Index measures the at-the-money implied volatility of SP 500 options. Now remember the diversification effect. An index of stocks is less volatile than the aggregate volatility of its individual components because the returns of the components don’t all move together. In other words, they are diversifying.
Joe Wiesenthal showed how correlations of stocks within the index have been falling. As correlation falls, the diversification effect gets magnified and therefore puts downward pressure on index volatility, or VIX.
If you are convinced that stock prices are destined to drop dramatically, one way for institutional investors to capitalize on this is to trade correlation (see this GSAM presentation). Kids – don’t try this at home. Unless you fully understand the math, the subtleties of trading correlation can be highly detrimental to your net worth.
A rolling correction
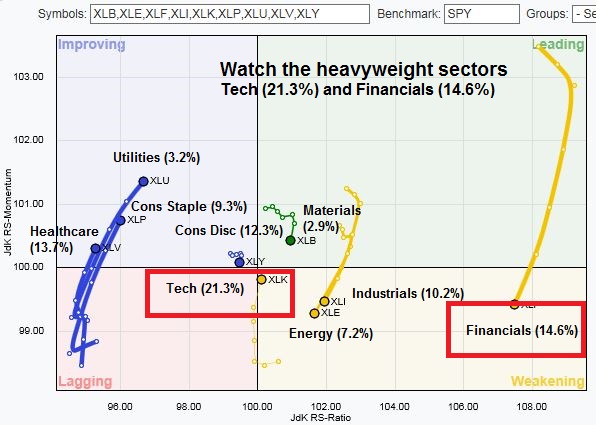
Here is a a far simpler explanation of why stock prices aren’t falling. The market has been moving sideways since December and it is undergoing a rolling correction. The chart below shows the RRG chart by sector. Cyclical sectors such as energy, material, and industrials have been correcting. Financial stocks, which had been market leaders, have retreated from a leadership position to the weakening category. By contrast, formerly weak sectors, such as consumer staples, healthcare, and utilities, are rising. More importantly, the heavyweight technology sector, which comprises 21.3% of the weight of the index, has been strengthening as well.
In order for the index to weaken significantly, we would have to see some evidence of stalling by technology stocks. So far, that’s not happening.
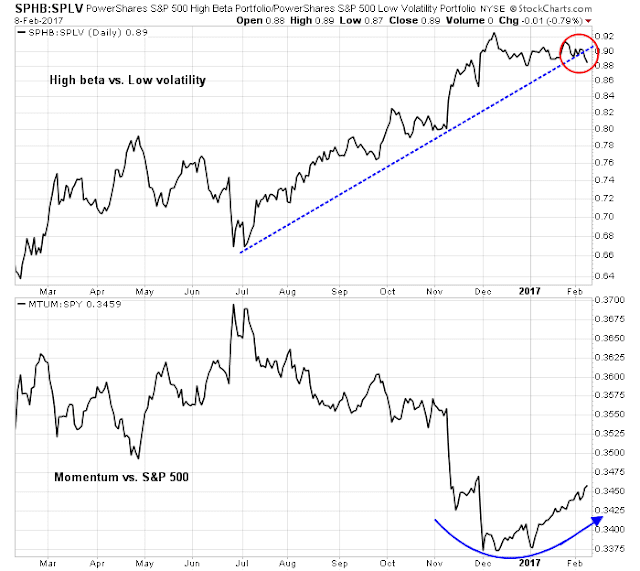
The top panel of the chart below shows that the high beta vs. low volatility ratio falling through its relative uptrend, which is a sign of falling risk appetite. However, the bottom panel shows that the relative performance of momentum stocks, which are mostly the glamour FANG names, have taken the baton of leadership.
In addition, I am watching whether the financial stocks can stabilize at these levels in light of the Trump administration to backtrack on Dodd-Frank. As well, the relative performance of this sector has historically been correlated to the shape of the yield curve. Will the yield curve steepen (bullish for financials) or flatten (bearish)?
If these two heavyweight sectors hold up, then it would be difficult to see how stock prices could correct significantly given the relative strength support of emerging sectors such as consumer staples, healthcare, and utilities.
More sideways consolidation
Having said all this, the recent technical violation of the SPX uptrend is not good news for the bulls. On the other hand, I find it difficult to make a case for a significant market correction under the current circumstances. There seems to be significant support at the 2260-2270 level. Until that zone is breached, the most likely scenario is a period of choppy sideways market action
My inner investor remains bullish on stocks. I outlined my intermediate term bull case in my weekend post (see Still bullish after my chartist’s round-the-world trip). My inner trade sold all of his long position and moved to cash today. The trading model has flashed a weak sell signal, but he is staying in cash due to the low conviction nature of the signal.


