The bull case
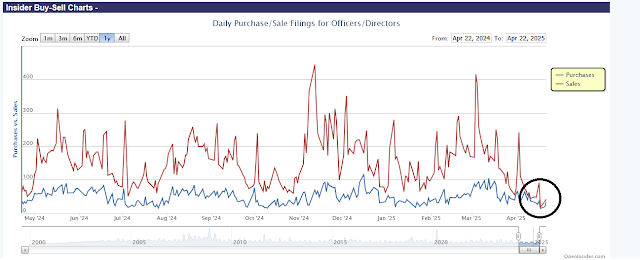
Goldman Sachs prime brokerage reported that systematic hedge funds had cut U.S. equity exposure to levels not seen since the COVID Crash. A market rally is likely to set of a short-covering stampede that could propel prices substantially higher.
A bear market rally
early June to early August”.
- Normal macro data and earnings report news
- Trade war news
- Anxiety about the stability of the USD
While the relief rally was sparked by “not as bad as the market expected” trade war news and Trump’s statement about he isn’t seeking to fire the Fed chair, the economy isn’t out of the woods just yet. The economic pain from Trump’s tariffs will be felt soon on Main Street. Shipping volumes are plunging and supply shortages will be evident by May and June. It was only about a month ago that a Pittsburgh-based Howmet Aerospace, a key supplier to Airbus and Boeing, declared force majeure on its contracts owing to the new tariff regime (see Force Majeure).
Jurrien Timmer at Fidelity offered a even darker short-term path by comparing the current trajectory of the S&P 500 to 1998 LTCM Crisis. In 1998, the market reached an initial low, rallied to the breakdown level and weakened soon afterwards to re-test the old low.
If history were to follow the 1998 template, watch to see if the S&P 500 can breach resistance at the 50% retracement resistance of 5500. As well, watch global fund flows to see if investors are still deserting the U.S. market. Continual selling pressure on USD assets will be a signal of a short-lived relief rally.


the only pattern I see is: Trump talks down the market. Trump folds, so the market gets a short relief rallye. Wash and repeat.
This can go on for weeks until the negative loop of uncertainty –> low investment makes a recession inevitable. And the Fed can’t be pro-active as long as inflationary tariffs are a dominant factor.
Trump needs to abandon the concept of tariffs as a major revenue factor, but if he does that, then his tax plan is too Lizzy Trussy for the bond market.
Cam, do you think gold and miners are due for a correction?
Yes. Gold very extended
Cam, if you draw your trendline from the February highs, the rally came right to the line, and then reversed hard?
Also, what are your thoughts on silver playing a little catch up to gold? The gold to silver ratio is getting a little bit out of line I would say.
Thanks