Preface: Explaining our market timing models
The latest signals of each model are as follows:
- Ultimate market timing model: Buy equities (Last changed from “sell” on 28-Jul-2023)
- Trend Model signal: Bullish (Last changed from “neutral” on 28-Jul-2023)
- Trading model: Bullish (Last changed from “neutral” on 16-Aug-2023)*
Update schedule: I generally update model readings on my site on weekends. I am also on Twitter at @humblestudent and on Mastodon at @humblestudent@toot.community. Subscribers receive real-time alerts of trading model changes, and a hypothetical trading record of those email alerts is shown here.
Subscribers can access the latest signal in real time here.
Bullish and bearish on different time horizons
As the S&P 500 violated its 50 dma but reached an oversold condition on the percentage of stocks above their 20 dma, I am bullish and bearish on stocks, depending on the time frame.
- Due for a Relief Rally: The market is due for a bounce (1–2-week horizon).
- A Deeper Correction: There may be unfinished business to the downside once the relief rally is complete (3–6-week horizon).
- Long-term Bullish: The technical structure of market action points to a longer-term bull trend.
Relief rally ahead
Let’s start with the shortest time frame. The market is sufficiently panicked and oversold that the odds favour a short-term relief rally.
The CBOE put/call ratio spiked last week, which is a sign of panic and contrarian bullish.
Two of the four components of my Bottom Spotting Model flashed buy signals last week. Historically, such conditions have signaled strong risk/reward long entry points for traders. The VIX Index spiked above its upper Bollinger Band, indicating panic, and the NYSE McClellan Oscillator (NYMO) fell below -50, which is an oversold condition.
The extreme level of the NYMO is especially notable. The indicator closed at -97.7 on Thursday, which is within a hair of the -100 mark. I went back to June 1998 and studied past instances when NYMO fell below -100, which is a rare event as there were only 20 non-overlapping instances when this happened. Median S&P 500 returns were strong after such signals and peaked eight trading days after the signal.
To be sure, last Thursday’s NYMO level does not constitute an NYMO signal based on a -100 threshold. But relaxing the test from -100 to -95 yields expands the sample size from 20 to 24 and the return patterns are very similar. I show the study based on a -100 threshold purely because it’s a round number. Regardless of whether the reading was -97.7 or -100, the market was very oversold.
A deeper correction
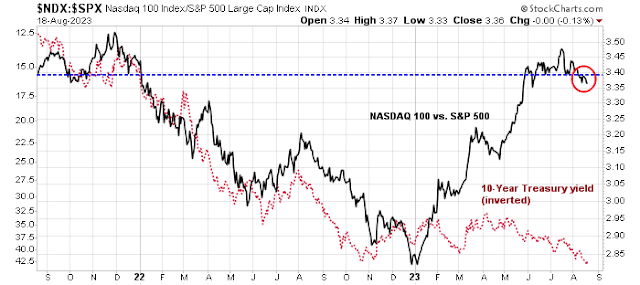
While the U.S. equity market appears washed out, oversold and poised for a rebound, the stall in large-cap technology stocks, and AI-related plays in particular, constitutes significant headwinds for the overall stock market. The relative performance of the NASDAQ 100 has historically been inversely correlated to the 10-year Treasury yield, which makes sense because growth stocks have higher duration than the broad market and are therefore more sensitive to changes in interest rates. The NASDAQ 100 began to diverge from the interest rate factor until recently when it violated a key relative support level. Notwithstanding the fact that bond yields are experiencing upward pressure today, the broad market would face substantial headwinds should the NASDAQ 100 close even half the gap shown on the chart. That’s because large-cap growth stocks, which consist of technology, communication services, and Amazon and Tesla within the consumer discretionary sector, represent over 40% of S&P 500 index weight.
The combination of faltering NASDAQ 100 and the outsized weight of large-cap growth within the S&P 500 argues for a deeper pullback once any reflex rally runs its course.
Long-term bullish
Even though I am concerned about a deeper correction, here’s why I am still long-term bullish. Such corrective action isn’t unusual after the stock market exhibits strong initial price momentum. The accompanying chart shows the history of the S&P 500 and the percentage of stocks above their 50 dma. Historically, a close 90% above their 50 dma after a 20% reading has generally resolved bullishly for stock prices. But the market often pulls back after the 90% reading, sometimes all the way back to the 20% level.
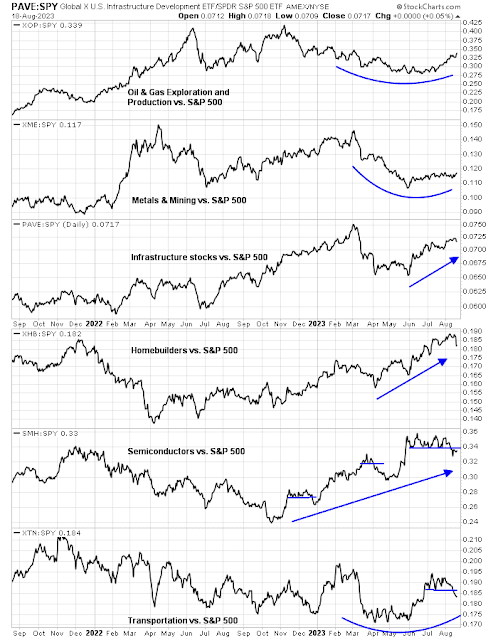
One mitigating factor that supports the bull case is the relative strength exhibited by cyclical industries. The relative performance of key cyclicals appears constructive, with the exception of semiconductors and transportation stocks. Even then, semiconductors remain in a relative uptrend, and these stocks have shown a stair-step upward pattern in the recent relative advance.
I would like to add a note about the disclosure of my trading account after discussions with some readers. I disclose the direction of my trading exposure to indicate any potential conflicts. I use leveraged ETFs because the account is a tax-deferred account that does not allow margin trading and my degree of exposure is a relatively small percentage of the account. It emphatically does not represent an endorsement that you should follow my use of these products to trade their own account. Leverage ETFs have a known decay problem that don’t make the suitable for anything other than short-term trading. You have to determine and be responsible for your own risk tolerance and pain thresholds. Your own mileage will and should vary.
Disclosure: Long SPXL


Cam,
Your statement, “Make no mistake, the AI party is over,” seems rather strong. Are you saying that all AI stocks have topped and won’t recover in the bullish phase post- deeper correction?
I think the path of the interest rates is key to the health of growth / tech stocks. What’s your opinion on the 10-year yields here?
Thank you. It is a good post.
The recent 10y yield rise is attributed to three factors.
1. Unwinding of recession position in bonds
2. Fitch downgrade of US debt
3. An unusual large amount of treasury auction this month following Fitch downgrade
One other factor probably also playing a role is a slow and small volume summer. But I bet the bulk of the adjustment is over.
Thanks for your response.
Correct. I think stronger than expected economic and jobs data is also played a role here.
My question was how can the equities rise (in long-term as Cam said) without a reversal in interest rates?
The adjustment may be over but I think we need the rates to track down for the markets to rise. I don’t know what factors would trigger that.
Perhaps, a slowdown in economy, jobs and inflation in coming weeks and months!
That’s because people say lower rates makes the market go up, but rates were going up in the 60s and the market went up. So it’s more complicated.
But there is a limit under normal conditions. The money supply, inflation they also play a role.
A lot of this is taking association as causation, it’s not.
The market does best if inflation is around 2 %, but that doesn’t mean that pinning inflation at 2 % will make the market do well. If we have a deep recession inflation will be less than 2 %. If we have high inflation money might shift to bonds which could depress the markets but chronic high inflation has a lag and real assets gain value. To the extent that growing companies represent a real growing asset, with time even inflation gets taken care of.
One thing that is pretty consistent is that when they drop rates something bad is happening, so the best thing is if rates stay in this range or change slowly.
High inflation is bad, low inflation is good and deflation is worse!
If NVDA reports good beats this Wednesday? and gets slammed then the AI party is likely over. Irrationality trumps common sense in the short run though.
I am curious to see what happens. No position in NVDA, but a tech pop could play a role in the S&P rallying over the next week or 2.