Preface: Explaining our market timing models
The latest signals of each model are as follows:
- Ultimate market timing model: Sell equities (Last changed from “buy” on 26-Mar-2023)
- Trend Model signal: Neutral (Last changed from “bullish” on 17-Mar-2023)
- Trading model: Neutral (Last changed from “bearish” on 15-Jun-2023)
Update schedule: I generally update model readings on my site on weekends. I am also on Twitter at @humblestudent and on Mastodon at @humblestudent@toot.community. Subscribers receive real-time alerts of trading model changes, and a hypothetical trading record of those email alerts is shown here.
Subscribers can access the latest signal in real time here.
A global market review
Now that the first half of 2023 is in the rear view mirror, let’s review how global equity markets performed. Here are the quick takeaways from a preliminary analysis of relative returns.
- U.S. equities were the leaders in Q2.
- Japan is becoming the new stealth leader, while Europe is pulling back.
- China and other emerging markets were weak on a relative basis.
Hwever, there were more subtle indications if we drill into the details by region.
Faltering U.S. leadership?
Starting with the U.S., there may be early indications that U.S. leadership may be
starting to stall. Large-cap growth stocks, as represented by the NASDAQ 100, had been on a tear for all of 2023 and their relative returns had become disconnected from the 10-year Treasury yield. More recently, the relative performance of growth stocks has flattened out against the S&P 500, which could be a sign of a loss in momentum.
As growth stocks have begun to stumble, value stocks haven’t taken up the mantle of leadership, which is a worrisome sign that breadth isn’t broadening out. While industrials have begun to turn up, other sectors continue to lag. More importantly, the heavyweight financial sector isn’t showing signs of relative strength. Without growth or value leadership, there’s isn’t much that leads U.S. stocks upward.
The view from Asia
China is experiencing a consumer recovery but foreign investors are reducing their exposure to the country. Mainland Chinese tourists are starting to travel abroad, with great impact on neighboring countries. The demand for semiconductors weakened from late 2022 enabling automakers to get the chips they need to ramp up production.
This bottom-up view is contrary to the consensus narrative of Chinese economic weakness. If the Chinese consumer revival plays out, it could be the spark for a rebound in Chinese sensitive equities around the world. For now, the relative performance of Asian equities are all flat to down except for Japan, which broke out of a long base and pulled back.
A bullish set-up in Europe
As we shift our focus to Europe, the Euro STOXX 50 staged an upside relative breakout in early 2023. While it has pulled back, the index has constructively stayed above its breakout level. If the China cyclical rebound narrative holds, European equities should benefit as a variety of European companies have strong exposure to Chinese exports.
Looking across the English Channel, U.K. equities may be showing signs of a bullish set-up. Large-cap U.K. stocks historically have been correlated to the relative returns of energy stocks, mainly because of their large energy weight. More recently, U.K. stocks have been flat while the energy sector has weakened, which is a positive divergence. Moreover, the relative performance of small-cap U.K. stocks, which are more reflective of the British economy, are bottoming out against their large-cap counterparts, which is a constructive sign. I interpret this as a bullish set-up for the U.K., but not a buy signal.
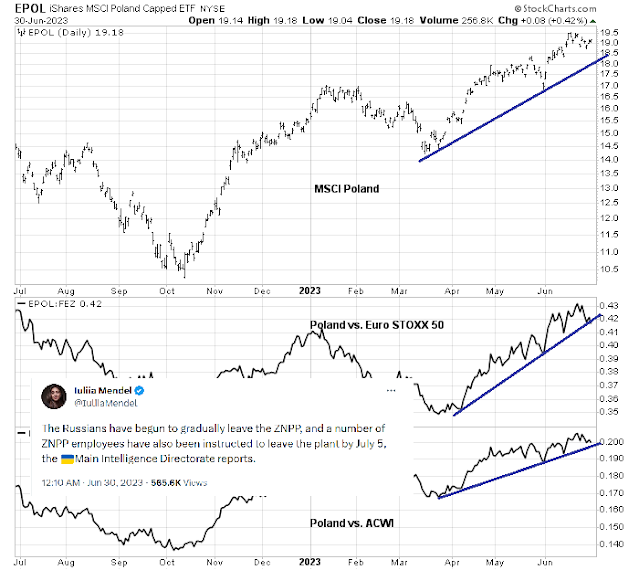
No discussion of Europe would be complete without highlighting the geopolitical risks of the Russo-Ukraine War. MSCI Poland has functioned well as an indicator of geopolitical risk, and Polish stocks have been in steady absolute and relative uptrends. However, a recent tweet indicates a heightened risk of deliberate sabotage at Europe’s largest nuclear plant.
In conclusion, a review of the relative performance of global equities shows preliminary signs of faltering U.S. leadership. Japan is slowly gaining and showing signs of revival. Anecdotal bottom-up indications of a Chinese cyclical rebound could spark a rally in China-sensitive stocks around the world, which will benefit China’s Asian trading partners, as well as many European companies that export to China.


