Preface: Explaining our market timing models
We maintain several market timing models, each with differing time horizons. The “
Ultimate Market Timing Model” is a long-term market timing model based on the research outlined in our post,
Building the ultimate market timing model. This model tends to generate only a handful of signals each decade.
The
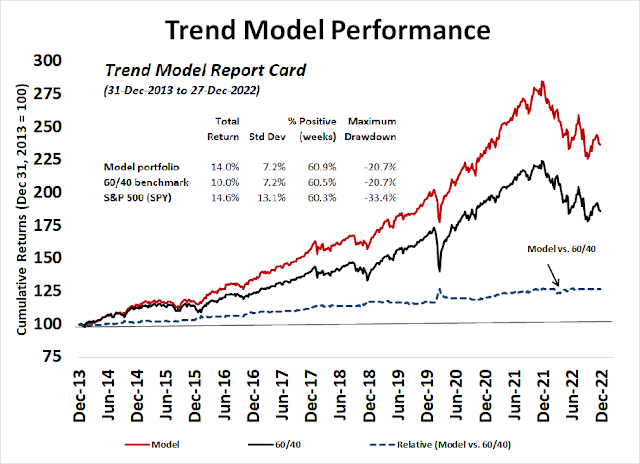
Trend Asset Allocation Model is an asset allocation model that applies trend-following principles based on the inputs of global stock and commodity prices. This model has a shorter time horizon and tends to turn over about 4-6 times a year. The performance and full details of a model portfolio based on the out-of-sample signals of the Trend Model can be found
here.
My inner trader uses a
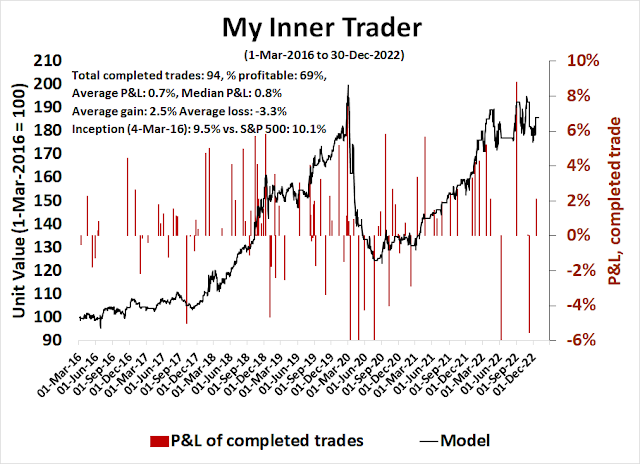
trading model, which is a blend of price momentum (is the Trend Model becoming more bullish, or bearish?) and overbought/oversold extremes (don’t buy if the trend is overbought, and vice versa). Subscribers receive real-time alerts of model changes, and a hypothetical trading record of the email alerts is updated weekly
here. The hypothetical trading record of the trading model of the real-time alerts that began in March 2016 is shown below.
The latest signals of each model are as follows:
- Ultimate market timing model: Sell equities
- Trend Model signal: Neutral
- Trading model: Neutral
Update schedule: I generally update model readings on my site on weekends. I am also on Twitter at @humblestudent and on Mastodon at @humblestudent@toot.community. Subscribers receive real-time alerts of trading model changes, and a hypothetical trading record of those email alerts is shown here.
Subscribers can access the latest signal in real time here.
Some hope for the future
Every market cycle is different, but all bear markets share some common elements, namely that asset prices fall. 2022 was unusual inasmuch as both stock and safe haven Treasury prices fell together. Nevertheless, there is some hope for the future.
Nine years ago,
Jesse Livermore found that forward 10-year equity returns were inversely correlated to household equity positioning. The equity bear market has sent household equity exposure skidding. I would further argue that the normalized position is actually lower. Normally, bond prices rise during equity bear markets, which raise bond allocations and depress stock allocations. When stock and bond prices fell in tandem in 2022, the diversification effect was lost. Household equity allocations should have been lower in a “normal” bear market (see
The hidden story of investor capitulation).
As investors bid goodbye to 2022, here is how my models performed during a difficult year.
Trading Model: A strong year
My inner trader had a good year in 2022. The
model portfolio of the trading model turned in a return of 15.0%, compared to -19.4% for the S&P 500 (excluding dividends). To be sure, there were some ups and downs as the model suffered drawdowns in August, but it was a very good year overall.
Trend Asset Allocation Model: A rare underperformer
The Trend Asset Allocation Model experienced a rare year of underperformance in 2022, which was the first time this has happened since I began keeping records in 2013. The model portfolio had a return of -16.8% compared to -16.6% for a 60% S&P 500 and 40% 7-10 year Treasury ETF portfolio, which is only lagging only marginally. However, the return record was still strong for longer-term time horizons.
The underperformance can be explained by the unusual return pattern exhibited by the S&P 500 and the 10-year Treasury Note, whose prices fell together. In the past, bond prices have acted as a counterweight to falling stock prices during equity bear markets. The Trend Model was designed to reallocate equity positions to a diversifying asset, namely Treasuries, during difficult markets. In 2022, the diversifying asset didn’t diversify.
h
Ultimate Market Timing Model
The ultimate market timing model was designed to be an extremely low turnover model that only flashes a signal every few years as a way of minimizing equity risk. It is known that trend following models that use moving averages can avoid the ugliest parts of the drawdowns during bear markets. The disadvantage to this class of models is they can flash false positive sell signals. The ultimate market timing model combines trend following with a macro overlay. It would only sell if the Trend Asset Allocation Model is cautious and top-down models indicate a growing risk of recession. This way, investors can avoid the worst of the market drawdowns during recessionary bears.
The ultimate market timing model flashed a sell signal in May. It is waiting for the Trend Model to turn positive before turning bullish again.
In conclusion, my quantitative model has shown mixed but generally positive results in 2022. I am generally equity bullish for 2023, though I am unsure of how much more downside risk remains. This looks like a plain vanilla recessionary bear market. It’s not the Apocalypse. Better returns are ahead.
Finally, I would like to take this opportunity to wish everyone a happy and prosperous 2023.


Cam,
Thanks for another year of your guidance and teaching us how to navigate the markets via your missives. Also thanks to the community that you have created, with all the other contributors, Ken, Ravindra, Yodoc2003, Rxchen, Alex_tm, et. al, I wish you a Happy and Healthy 2023
Agreed, also a shout-out to, Ingjiun, Jan, Intrepid and Sanjay
Happy New Year to our fellow students.
Here is a small summary showing where we are at and what to expect going forward.
1. SP500 earnings are expected to bottom at middle of this year based on Refinitive IBES data. 3Q growth is about flat yoy, but 4Q growth is at low double-digit yoy. USD might help with its weakness.
2. First two Q’s this year will be negative growth yoy. Market probably already reflected the numbers.
And then everything depends on labor markets.
3. Continuous jobless claims ROCs show the same pattern as a sure sign of recession to come, based on previous cycle readings.
4. But like a few months ago, Beveridge curve shape remains the same, indicating a strong labor market, and hence a solid economy.
5. And home building stocks remain very stable, indicating a stable economy.
Put together, it looks like a muddle-thru and then recovery. It may or may not be a recession. This week’s top-tier labor market numbers from BLS will give us a better gauge.
Cam or anyone: many pundits out there are bullish on the China reopening trade. Dipped my toes into FXI and KWEB. So far so good. How far can it run?
I’ll be publishing a discussion of the China reopening trade this weekend.