Mid-week market update: Some elements of the market have recently taken on a definitive risk-off tone, such as yesterday’s upside breakout in gold that was achieved in spite of a similar upside breakout in the USD Index.

That has to be equity bearish, right? Well…this time is (sort of) different.
Macro headwinds
Let us first unpack some of the macro headwinds that are becoming evident for investors. Notwithstanding the human toll, as investors we are more concerned about the possible economic effects of this outbreak.
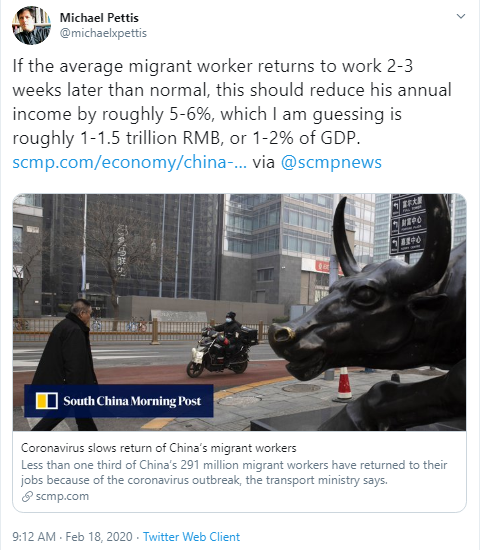
As China slowly returns to work, it is difficult to estimate the full impact of the virus, and the shape of the economic recovery. At a minimum, expect a 1-2% hit to GDP from the migrant worker effect, based on the comments of ell-known China watcher Michael Pettis.
Today, not many analysts trust Chinese statistics on the Covid-19 coronavirus. However, statistics pertaining to the progression of the infection outside China is more certain. As the latest update from Johns Hopkins CSSE shows, there are no signs that the infection rate is slowing down.

To be sure, much of the case growth can be attributable to burgeoning infections aboard the Princess Diamond cruise ship, which is a case where the health authorities fumbled the response. The ship became a hotbed of infections, with patients now being dispersed to their home countries and becoming more potential disease\vectors. Nevertheless, the combination of Apple’s warning and the risk of an uncontrolled global pandemic is raising the tail-risk of a prolonged global slowdown considerably.
A flight to USD safety
I had suggested before that US equities was the beneficiary of a fear trade as foreign investors were buying USD assets as a safe haven trade (see Why the market is rallying on fear – Yes, Fear!). It is therefore unsurprising that gold and the USD are rising in concert because of rising anxiety over a the prospect of a coronavirus induced global slowdown.
As shown in the chart below, the USD, long bond, and US equities have rising together. The environment only turns bearish if equities and the other asset classes start to decouple.

Subscribers received an email yesterday alerting them to a potential change in the trading model signal. It would change from bullish to bearish if TLT staged an upside breakout on a closing basis, which has failed so far at resistance.

Bull or bear?
While I made the point that “this time is (sort of) different”, it does not necessarily mean that the conclusion is necessarily equity bullish.
To be sure, Tuesday’s price action was a surprise. QQQ ended the day positive and ahead of a negative SPY day despite heavyweight Apples negative guidance. The bulls would interpret that as a sign that the market is shrugging off bad news.
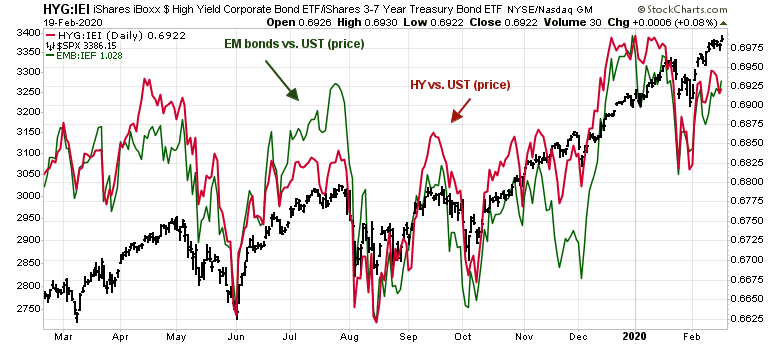
On the other hand, credit market risk appetite is not behaving well. The relative price performance of high yield (junk) bonds against their duration equivalent Treasuries, as well as the relative performance of EM bonds, are not confirming the equity market advance.
As a consequence, it pays for investors and traders to be cautious. The S&P 500 is already testing short-term trend line resistance on the hourly chart.

For the last word, I leave you with this tweet from SentimenTrader.

In conclusion, the weight of the evidence suggests that the risk/reward is tilted to the downside. The trading model will therefore switch from bullish to bearish as of tomorrow, and my inner trader will flip short in the moring.
Most of you have probably already seen SentimenTrader’s other tweet today, which I’ll copy below.
‘Options traders spend billions betting that this rally won’t end
‘6 weeks of speculation
‘Since early January, options traders have been aggressively betting on a continued ramp higher in stocks. It’s mostly paid off, and they keep pressing. Each week that goes by without a pullback, traders become more aggressive, and by some measures, they’ve never been more exposed.
‘They’ve been spending heavily on that opinion. With the surge in call buying, their total outlay has exceeded more than $7 billion in premiums paid each of the last two weeks. That’s far beyond anything we’ve seen in the past 20 years. Over the past 5 years, it’s almost double the previous record.
‘Total premiums on call options
‘In a market that’s enjoyed a couple months of “nothing matters,” it’s hard to imagine that this kind of speculative activity won’t be punished. The exact timing is never certain, but in markets, when it gets this rewarding to be this carefree, a punishment almost always follows.’
Good call, Cam.
Ya good call!
With commission-free stock trading now, my guess is that extremes will be greater than the past. Crazy will get crazier. Currently we are just at normal crazy bullish with option trading. Prepare for the absurd.
When things get crazy, nothing wrong with moving to cash – it’s surprising the disdain with which many investment managers view that particular option (which now btw returns close to 2% annually at most brokerage houses).
Ken is talking about a Y2K style NAZ blow out top here for the general market (S&P 500). Yes, after that blow out, one could cash out. That said, the 30% or so rally last year and this year, is starting to feel like a blow out top, in retrospect. Steep rise of Virgin Galactic, Tesla, massive options trades by mom and pop investors (Ameritrade) is starting to feel somewhat speculative but the euphoria is not there (see CNN fear and greed), at least not yet.
I wonder if the commission-free stock trading will make the downside trek even more absurd as well (within the confines of free money, courtesy of Central Banks).
Good thought; it might.
So, is this time to buy the 50% retracement of gold (1200-2000), circa 1600$?
Gold looks bullish but it also looks extended short-term. Not sure if you necessarily get a 50% retracement, but I would add to long positions on a pullback.
I guess, I was less than clear. Gold made a peak just below 2000$ around 2011 and then a long bottom around 1200 (I have rounded off the numbers). 1600$ is a 50% retracement of that range. I agree, in the short term, it would be hard to get a 50% retracement of 1200-1600$ range.
A few months ago, you had written about extreme long position in the gold market (I think the data was from COT). It appears that extreme one sided positioning has become even more one sided, based on the price action.
CoT data (albeit a little old) still shows a very crowded long in gold.
https://hedgopia.com/cot-peek-into-future-through-futures-how-hedge-funds-are-positioned-142/
https://www.marketwatch.com/story/why-bullishness-on-gold-is-likely-to-prompt-a-drop-in-prices-in-coming-sessions-2020-02-21?mod=mw_latestnews
Yen is no longer a safe haven. Time for USD, US bonds and gold in risk-off periods?
https://www.wsj.com/articles/japans-pension-whales-may-be-making-waves-in-currency-markets-11582285660