We all know about how the business model of the robo-advisor works. First, determine the appropriate asset mix based on the risk, return, tax regime and other specific needs of the client. Then, build the portfolio and rebalance it on a periodic basis. The typical investment process can be summarized by the following steps:
- Determine the target asset mix, which could change depending on market conditions.
- Re-balance if:
- The asset mix weights moves more than a certain percentage, e.g. 10%, from the target weight; or
- Periodically, such on an annual basis These are all sensible rules that have long been practiced in the investment industry. In essence, the strategy involves taking profits on winning asset classes and averaging down on losers as a form of risk-control discipline
By following these simple rules, a portfolio will get investing decisions similar to what is depicted in the chart below. The top panel shows the price chart of the Dow Jones Global Index and the bottom panel shows the relative price performance of DJ Global against US Treasuries. Depending on the exact rebalancing rules, a fixed-weight portfolio that re-balances periodically will buy stocks near the bottom of the market and sell them near the top.
While the basic business model of the robo-advisor remains unchanged, I can see a couple of competitive threats to the standalone robo model. In fact, these threats may spell a peak of the standalone robo-advisor.
Robo-advisor as fiduciary
First, the standalone robo business model faces a regulatory problem. ThinkAdvisor reports that the law firm of Morgan Lewis believes that robo-advisors may be deemed to be fiduciaries under the Investment Advisor Act of 1940:
Robo-advisors can satisfy fiduciary standards set out by the Securities and Exchange Commission’s “flexible” principles under the Investment Adviser Act of 1940, according to a newly released report by the law firm Morgan Lewis.
In their white paper, “The Evolution of Advice: Digital Investment Advisers as Fiduciaries,” Morgan Lewis attorneys argue that critics who have questioned robo-advisors’ ability to meet fiduciary standards “proceed from misconceptions about the application of fiduciary standards, the current regulatory framework for investment advisors, and the actual services provided by digital advisors.”
If that is indeed the case, then the cost structure of standalone robos will change in a dramatic fashion. No longer can portfolio advice can be generated by software, but varying degrees of human intervention will be required. Any standalone robo-advisor that tries to run its business on autopilot without human oversight is like a car company introducing a self-driving vehicle with imperfect software. The minute there is an accident, whether automotive or financial, it will be an invitation for class action litigation. Bottom line: extra costs will get passed on to customers.
From the client’s viewpoint, the value proposition of the robo-advisor will change as the fee structure rises.
Beating robo-advisors at their own game
In addition, there may be better ways of rebalancing a portfolio while keeping the basic principles of a customized asset mix. I came upon an intriguing paper by Granger, Greenig, Harvey, Rattray and Zou entitled Rebalancing Risk. Here is the abstract:
While a routinely rebalanced portfolio such as a 60-40 equity-bond mix is commonly employed by many investors, most do not understand that the rebalancing strategy adds risk. Rebalancing is similar to starting with a buy and hold portfolio and adding a short straddle (selling both a call and a put option) on the relative value of the portfolio assets. The option-like payoff to rebalancing induces negative convexity by magnifying drawdowns when there are pronounced divergences in asset returns. The expected return from rebalancing is compensation for this extra risk. We show how a higher-frequency momentum overlay can reduce the risks induced by rebalancing by improving the timing of the rebalance. This smart rebalancing, which incorporates a momentum overlay, shows relatively stable portfolio weights and reduced drawdowns.”
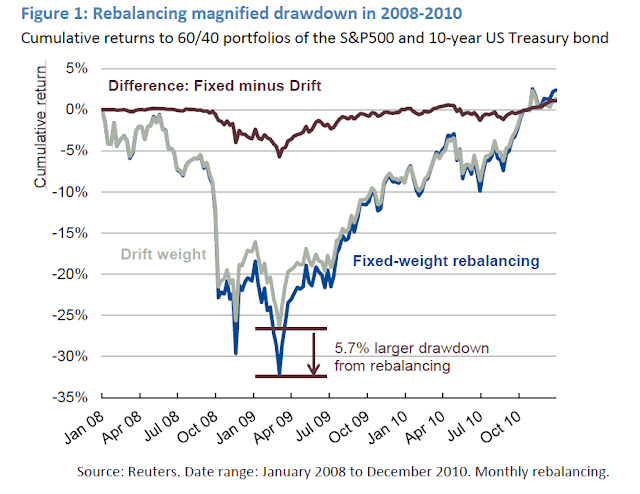
You would think that, for example, given the massive losses seen during the Lehman Crisis episode, that a rebalanced portfolio where the investor bought all the way down would see superior returns. Interestingly, that was not the case. In the paper, the authors compare and contrast a simple drift weight strategy, i.e. not rebalancing at all, with a fixed weight monthly rebalancing strategy. The chart below shows how that the monthly rebalanced portfolio actually showed a higher risk profile than the passive drift portfolio. (There were other examples in the paper, but I will focus on this period for the purpose of this post).
By contrast, they advocate a partial momentum strategy. In essence, this amounts to the application of a trend following system to rebalancing. The idea is, as the stock market goes down and the bond market goes up, you keep overweighting your winners (bonds) and don’t rebalance the portfolio until momentum starts to turn. As the chart below shows, the portfolio with the partial momentum overlay performed better than either the monthly rebalanced or passive drift weight portfolio.
Talking their book?
These are intriguing results and a demonstration of the positive effects of using trend following techniques for portfolio construction. However, I would add a couple of caveats in my read of this paper. First, three of the five authors work for MAN Group, which is known for using trend following techniques in their investing. While this paper does show the value of these kinds of techniques, I am always mindful that researchers may be “talking their own book”.
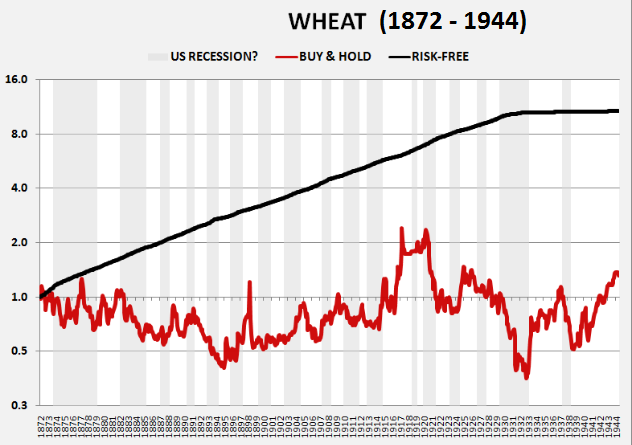
As regular readers are aware, I extensively use trend following models in my own work, but I am cognizant of the weaknesses of these models. In particular, these models perform poorly in sideways choppy markets with no trends. As an example, consider this chart of sugar prices for the period from 1891 to 1938. Unless the trend following system is properly calibrated, the drawdowns using this class of model are potentially horrendous.
As another example, try wheat prices for the 1872 to 1944 period:
A second critique of the approach used by the paper is the use of monthly rebalancing as one of the benchmarks. In practice, no one rebalances their portfolio back to benchmark weight on a monthly basis. A more realistic rebalancing technique might be a rule based rebalancing approach of rebalancing either annually or if the portfolio weights drift too far from the policy benchmark. To be fair, however, the monthly rebalancing approach is an extreme one that does differentiate between a passive drift weight and a more frequently rebalanced portfolio.
Co-opting the robo model
In summary, this is an intriguing paper that compares and contrasts the use of price momentum, or trend following, techniques of chasing winners to a value-based rebalancing strategy of buying assets when they are down. This use of trend following principles could turn out to be a useful way to both reduce portfolio risk and increase returns at the same time. Before going out and blindly implementing a trend-following based re-balancing program, portfolio managers should study these approach and adopt it to their own circumstances.
Nevertheless, this simple exercise shows that the combination of regulatory changes and thoughtful human intervention allow human advisors to beat the robo-advisor at its own game. This suggests an approach of using robo advisory tools to form target portfolios for clients and at the same time allowing the flexibility of a human override as a “sanity check” on model output as different ways of adding value over and above what a standalone robo can offer.


“This suggests an approach of using robo advisory tools to form target portfolios for clients and at the same time allowing the flexibility of a human override as a “sanity check” on model output as different ways of adding value over and above what a standalone robo can offer.”
This is a recurring problem with every investing model, whether technical, fundamental, astrological, or any crazy combo anyone comes up with. Because people are influenced by recent trends and other people, we tend to get bullish at tops and bearish at bottoms. The purpose of a model is to remove human emotion from the picture, and buy even though the human operator is scared, and sell even though the human is optimistic.
As soon as you say that, as a “sanity check” the humans are allowed to override the model, then you have destroyed its purpose, and made any evaluation of the complete system (including the occasionally intervening human) impossible.
Models are designed by people who study the past, and the more time elapses, the more seemingly independent models will adopt similar strategies. At some point too much money is all bet the same way, and that is when things suddenly become discontinuous and the market acts in the worst possible way for those models.
The answer is: there is no answer.
Still, between the two, if I weren’t running my own money, I’d prefer to hand it over to an older, experienced person who I felt had good judgment, rather than use a mechanistic model.
I’m totally opposed to the rebalncibg concept. It is anti-momentum and momentum is an academically proven winning concept.
Your first chart showing rebalancing at the top and bottom of bull and bear markets never happen in the real world. What happens is that an investor is selling winning investments to buy underperformers for years on the way up and down.
Look at an investor in European and emerging market sectors. For the last few years they would be sending good money after bad by rebalancing.
Also people buy to rebalance those things that are down the most. They seem the biggest bargain. So many people were buying bank stocks as they eere crashing in 2008 for that reason.
The concept of rebalancing is based on things reverting to previous means. Look around us. Things are not reverting back to old norms.
Thanks for the common-sense analysis. This post reminds me that I’d like to see a sector rotation graph periodically.