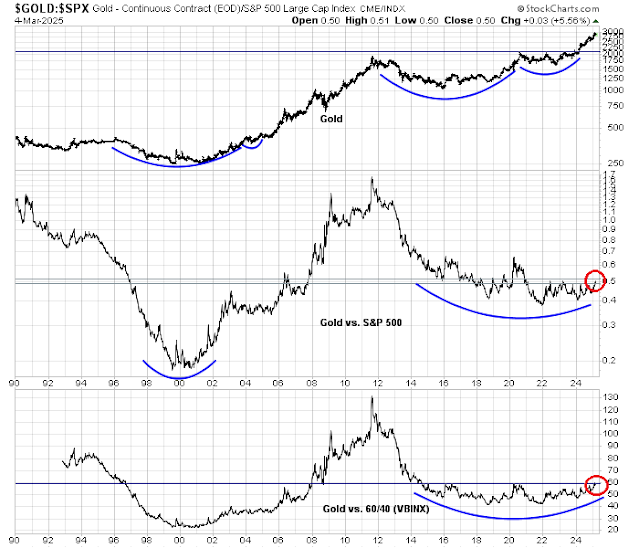
Gold has caught a bid against a backdrop of trade war fears. On the other hand, gold ETF AUM is skyrocketing, which is contrarian bearish.
Negative seasonality
The answer depends on your time horizon. Callum Thomas pointed out that March tends to a period of negative seasonality for gold prices. Buyers should therefore be cautious.
A long-term breakout
However, investors should nevertheless consider that gold is on the verge of an upside relative breakout against the S&P 500. It has already broken out against the passive Vanguard 60/40 fund (VBINX). These are highly constructive signals for gold from a long-term perspective.
Inflation ahead
In addition, ISM prices paid has shown a 6-9 month leading relationship with inflation, which should be bullish for gold prices in the near future.
This is consistent with the observation of an upward sloping trend in inflation surprise on a global basis.
From a trader’s perspective, I would be inclined to monitor the 14-day RSI of Gold Miners (GDX) for clues of a tactical bottom. If history is any guide, an oversold condition in the 14-day RSI (top panel) is a sign that the bottom is either near or at hand.


Cam – do you prefer GDX ETF over GLD ETF when an oversold condition in the 14-day RSI is achieved?
The difference in the consistent uptrend in bullion and the lagging, very swingy gold miners reinforces that bullion is being accumulated by sovereign nations that are shifting away from the American dollar as Trump is losing American exceptionalism.
The miners have to be dragged higher reluctantly. Sprott’s new actively managed gold and silver miners ETF has a message on their website that says forward PE is now 12 times with projected annualized 38% earnings growth over the next three years. BTW, I’m just saying and not recommending.
Charles Gave, a long-time great strategist, says the S&P 500 to bullion ratio falling below its 200 day moving average is a bear market signal. Just sliced through like a hot knife through butter.
What kind of chart would he have used for that, one wonders?
When I look at $SPX:$GOLD, the rate penetrated the 200 DMA in early 2025, but this is a normal occurance and whipsaws often.