Preface: Explaining our market timing models
We maintain several market timing models, each with differing time horizons. The “Ultimate Market Timing Model” is a long-term market timing model based on the research outlined in our post, Building the ultimate market timing model. This model tends to generate only a handful of signals each decade.
The Trend Model is an asset allocation model which applies trend following principles based on the inputs of global stock and commodity price. This model has a shorter time horizon and tends to turn over about 4-6 times a year. In essence, it seeks to answer the question, “Is the trend in the global economy expansion (bullish) or contraction (bearish)?”

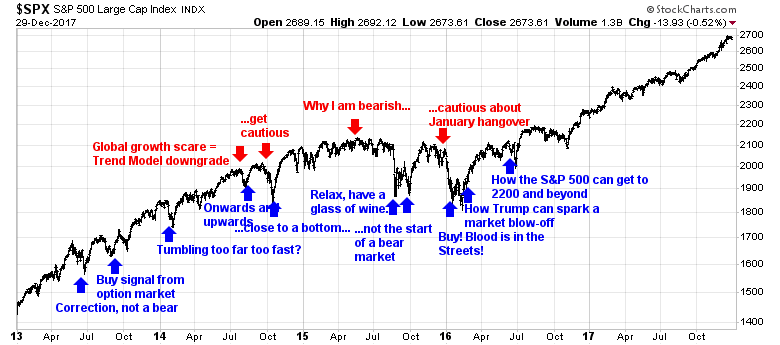
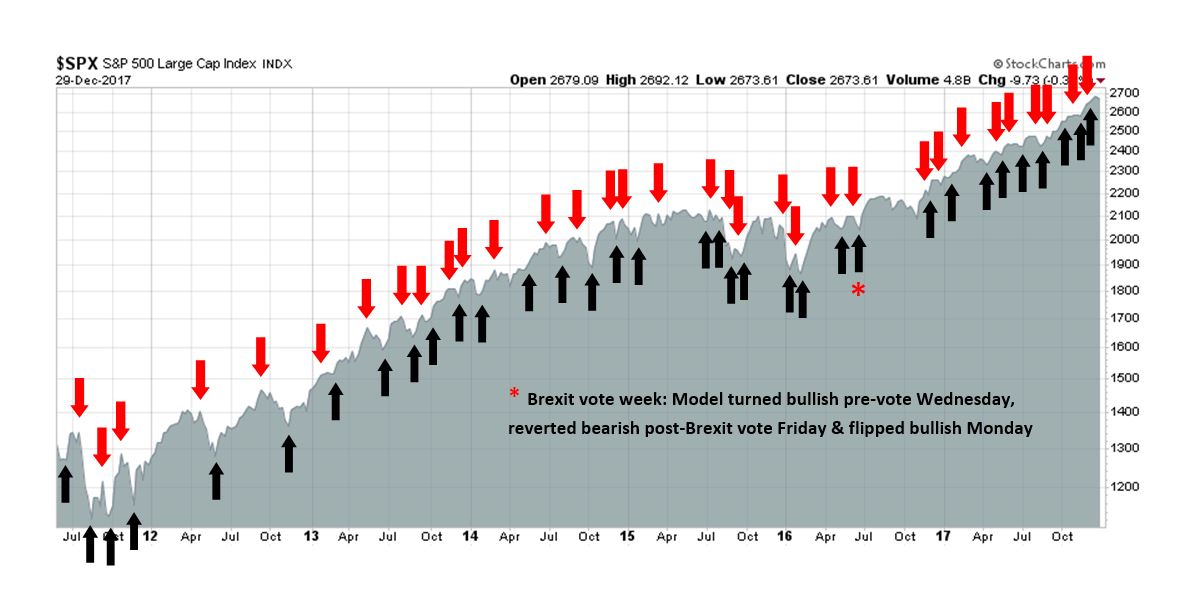
My inner trader uses the trading component of the Trend Model to look for changes in the direction of the main Trend Model signal. A bullish Trend Model signal that gets less bullish is a trading “sell” signal. Conversely, a bearish Trend Model signal that gets less bearish is a trading “buy” signal. The history of actual out-of-sample (not backtested) signals of the trading model are shown by the arrows in the chart below. Past trading of the trading model has shown turnover rates of about 200% per month.
The latest signals of each model are as follows:
- Ultimate market timing model: Buy equities
- Trend Model signal: Bullish
- Trading model: Bullish
Update schedule: I generally update model readings on my site on weekends and tweet mid-week observations at @humblestudent. Subscribers will also receive email notices of any changes in my trading portfolio.
Marking my 2017 calls to market
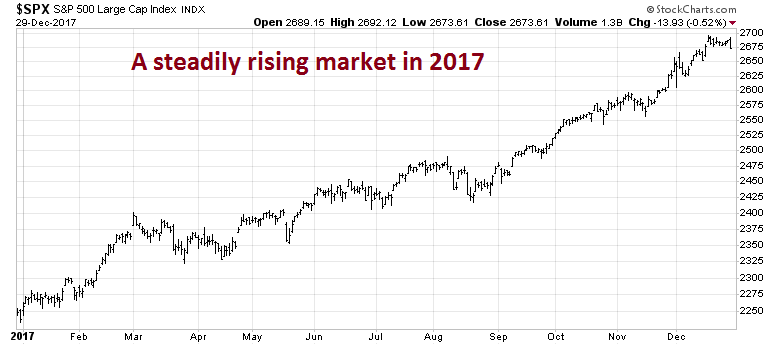
As 2017 draws to an end, it’s time to mark my 2017 forecasts to market. Overall, the stock market in 2017 was remarkable. What if I told you that you could have had returns with a Sharpe Ratio of 3.2, using the 3-month T-Bill as the risk-free rate? As it turns out, you could have achieved that with a simple buy-and-hold long position in the SPX, whose Sharpe ratio is the second highest in its history in the last 59 years (via Vincent Deluard of NDR).

Indeed, US equities rose steadily in 2017. The drawdown was only 3% in the year, which is a feat that was last achieved in 1995.
With that in mind, I review my inner investor and inner trader calls of 2017. My inner investor gave himself a grade of B+, and my inner trader gave himself an C+ for the year.
My inner investor: Never bearish
When I reviewed my the investment calls for my inner investor persona in 2017, I struggled to find periods when I turned bearish. While I was cautious at various times, my inner investor was either bullish, or neutral, which indicated an asset allocation that is in line with investment policy weights. (If the investment policy called for a 60% stock/40% bond target mix, a neutral position would see the portfolio rebalance by taking profits in equity positions and buying bonds back to 60/40 mix.)
In August 2016, my original base case scenario called for a stock market top in late 2017 (see The roadmap to a 2017 market top).
By December, I changed my mind and I was bullish on how Trump may affect stock prices (see How Trumponomics could push the SP 500 to 2500+).
By February, I began to think about the possibility that this bull may resolve itself with a blow-off top (see A blow-off top or a wimpy top).
I began to get a little cautious in March, but never pushed the sell button (see A toppy market, but not THE TOP). At the time, I observed that “the music is still playing”. Similarly, I outlined A market top checklist in May, and concluded that “there are no signs of an intermediate market top”.
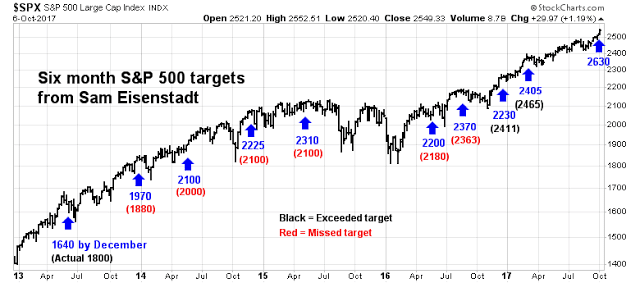
In October, I highlighted former Value Line Research Director Sam Eisenstadt’s SPX forecast of 2620 to 2640 by March (see Is 3% for 6 months enough to take equity risk?). I was cautious about a combination of overbought conditions, and excessive bullishness, but nevertheless believed in buying the dip, should it occur. About 10 days later, I reversed my cautious outlook and concluded that the market was in a process of a slow grind upwards (see A slow grind upwards).
By November, I threw caution to the wind and began to see the blow-off top as the most likely outcome (see Embrace the blow-off (but with a stop-loss discipline)). The combination of price and fundamental momentum leading to a risk-on stampede had become my base case scenario.
Even though I never turned outright bearish sentiment was becoming increasingly frothy. I initiated my series “What you don’t see at market bottoms” in mid-2017. However, I did recognize that overly bullish sentiment represents an inexact market timing signal.
- Things you don’t see at market bottoms, 23-Jun-2017
- Things you don’t see at market bottoms, 29-Jun-2017
- Things you don’t see at market bottoms, bullish bandwagon edition
- Things you don’t see at market bottoms, Retailphoria edition
- Things you don’t see at market bottoms, Wild claims edition
- Things you don’t see at market bottoms, No fear edition
- Things you don’t see at market bottoms, Paris Hilton edition
- Things you don’t see at market bottoms, Halloween edition
- Things you don’t see at market bottoms, CFD edition
- Things you don’t see at market bottoms: Rational exuberance edition
Overall, my inner investor would give himself a B+ for 2017. The stock market went up, he never turned bearish, but he penalized himself for turning neutral at various times during the year.
My inner trader: Who needs market timing?
My inner trader was not so fortunate. When you are trading a market that goes straight up, why do you need a market timing model?
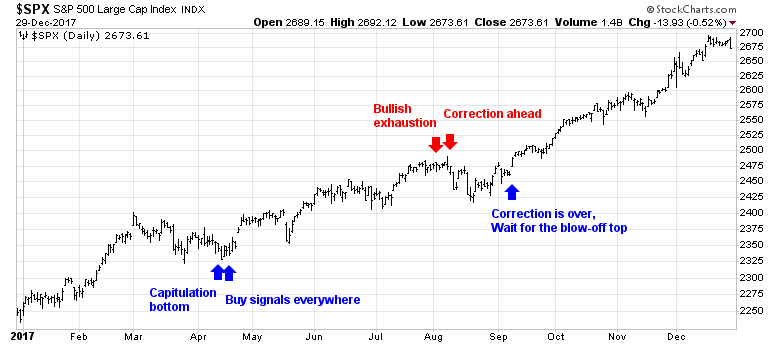
Still, the year 2017 was not without its trading highlights. In April, I correctly issued two trading calls to buy the market (see A capitulation bottom and Buy signals everywhere). I also correctly turned cautious in early August (see Bullish exhaustion and Correction ahead). While prices did decline, the market barely weakened and I was a little late in turning bullish (see Correction over, wait for the blow-off top). Such are the hazards of trying to market time when corrections are shallow and brief.
Over the years, I had received a number of requests to quantify the returns on my trading system signals that are shown in the chart below. I was reluctant to do so, largely because there are a number of key factors involved in calculating the returns of a portfolio and publishing a single number would mask the dispersion from any actual results (see From alpha to actual returns: Why your mileage will vary):
- When and what do you buy and sell?
- How much do you buy and sell?
- How do you time the trade?
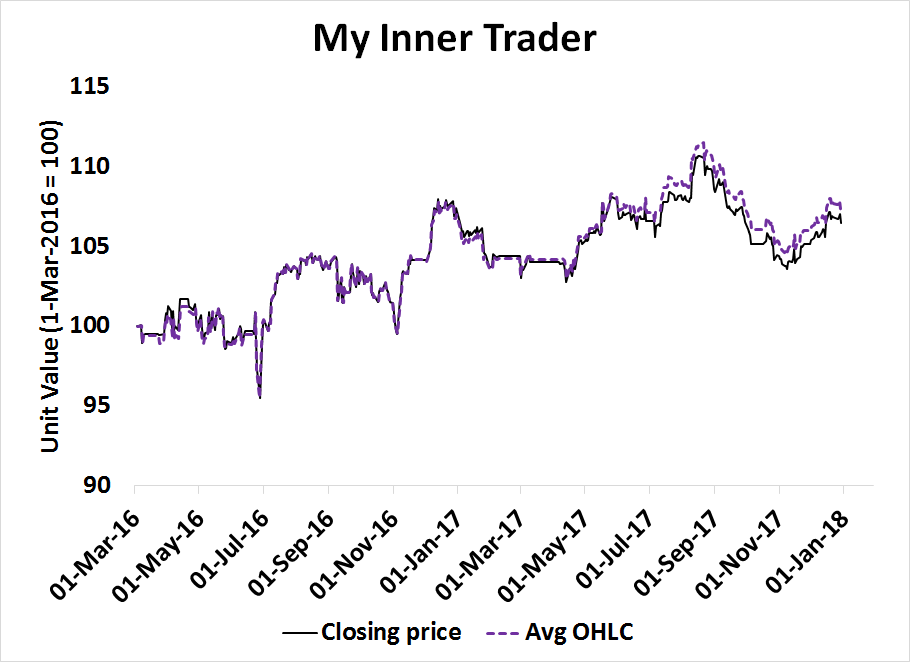
As a compromise, I calculated the trading record of “my inner trader”, whose history began when I started to issue trading alerts to readers on 4-Mar-2016. From now on, these results will be updated weekly on the website at My inner trader. These returns are purely hypothetical and do not represent the performance of any trading account. In other words, your own mileage will vary.
The return calculations shown are based on the following assumptions:
- The instrument traded is the S&P 500, regardless of whether the trade alert was on any other index. This return series was calculated as a way to measure the long or short systematic direction of the trade, whereas the instrument selected (usually either NASDAQ 100 or Russell 2000) was purely discretionary.
- Execution is done at the closing price on the day of the signal.
- There are no transaction costs.
- There are no dividends.
- The account allocates 100% of the value to the trade, i.e. it goes fully long or short.
- If the account holds cash, the cash earns no interest.
A chart of the history of the account value is shown below.

There were a total of 15 trades in 2017. The success rate for completed trades was 67%, with an average profit of 0.4% per trade. As the chart below shows, the success rate in 2017 was roughly the same as it was in 2016.
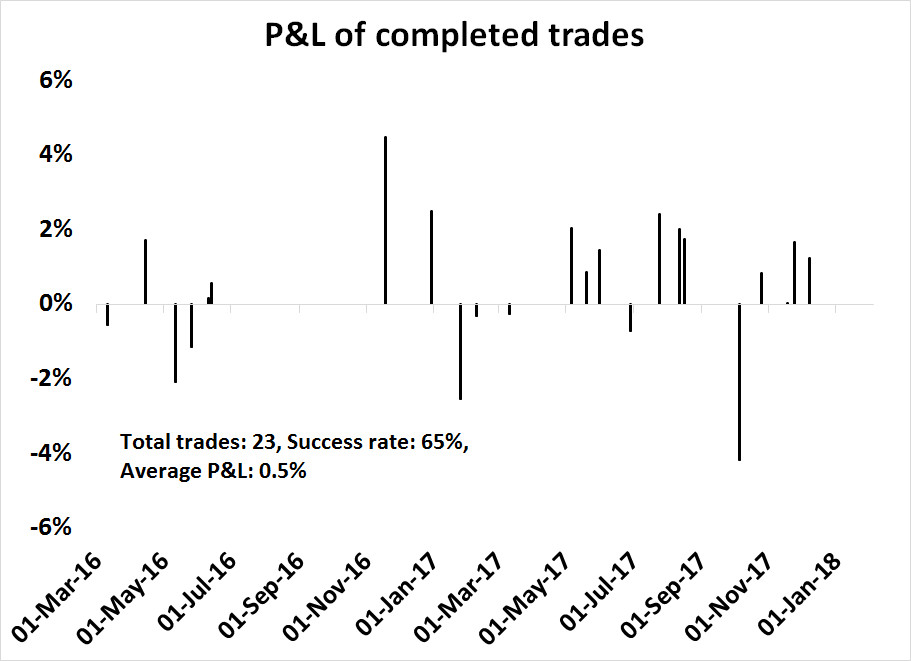
The history of the trading signals are as follows:
04-Mar-16 Buy
10-Mar-16 All cash, sell long
23-Mar-16 Buy
14-Apr-16 All cash, sell long
20-Apr-16 Buy
11-May-16 Short
26-May-16 Buy
10-Jun-16 Short
13-Jun-16 All cash, cover short
21-Jun-16 Buy
18-Nov-16 All cash, sell long
01-Dec-16 Buy
29-Dec-16 Short
25-Jan-17 Buy, P/L: -2.5%
08-Feb-17 All cash, sell long, P/L: -0.3%
28-Feb-17 Short
10-Mar-17 All cash, cover short, P/L: -0.3%
06-Apr-17 Buy
05-May-17 All cash, sell long, P/L: 2%
08-May-17 Short
19-May-17 Buy, P/L: 0.9%
31-May-17 Short, P/L: 1.4%
28-Jun-17 All cash, cover short, P/L: -0.7%
05-Jul-17 Buy
24-Jul-17 Short, P/L: 2.4%
11-Aug-17 Buy, P/L: 2%
16-Aug-17 All cash, sell long, P/L: 1.7%
18-Aug-17 Short
05-Oct-17 All cash, cover short, P/L: -4.2%
16-Oct-17 Buy
25-Oct-17 Short, P/L: 0.8%
17-Nov-17 Buy, P/L: 0%
24-Nov-17 All cash, sell long, P/L: 1.7%
30-Nov-17 Short
07-Dec-17 All cash, cover short, P/L: 1.2%
08-Dec-17 Buy
I went further by performing some sensitivity analysis by asking the question, “What would the returns be if the executed price was the average of the open/high/low/close, instead of the closing price?” The results were not significantly different.
Another form of sensitivity analysis involves the question, “What would the returns be if the trades were done 1, 3, and 5 days after the signal? (where t=0 is the signal date)”
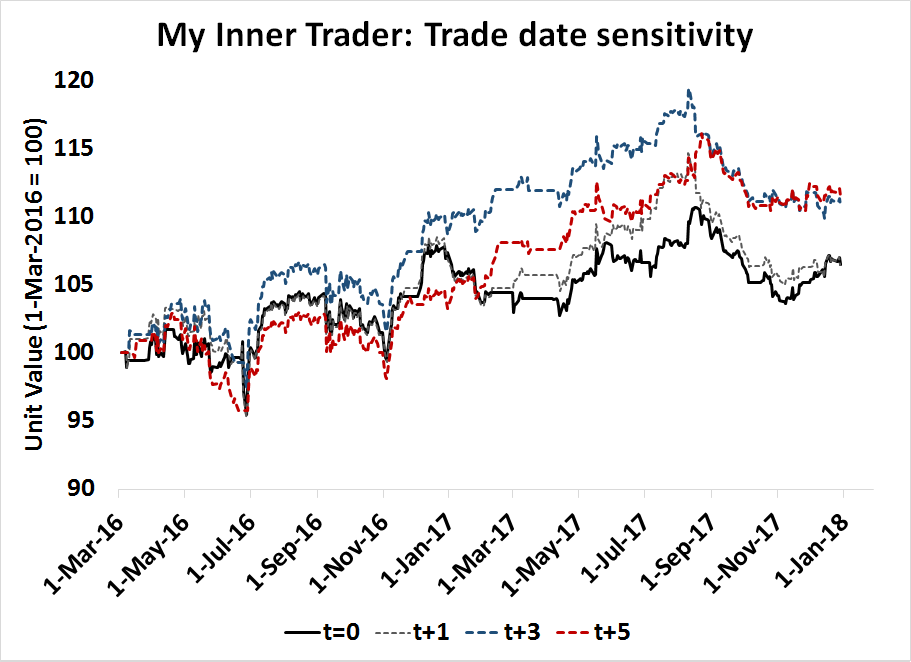
As it turns out, the trading system was not very good at pinpointing exact entry and exit points. There were instances where trading 3-5 days later yielded better returns. However, the positive relative performance was mostly attributable to poor trade timing in early 2017.
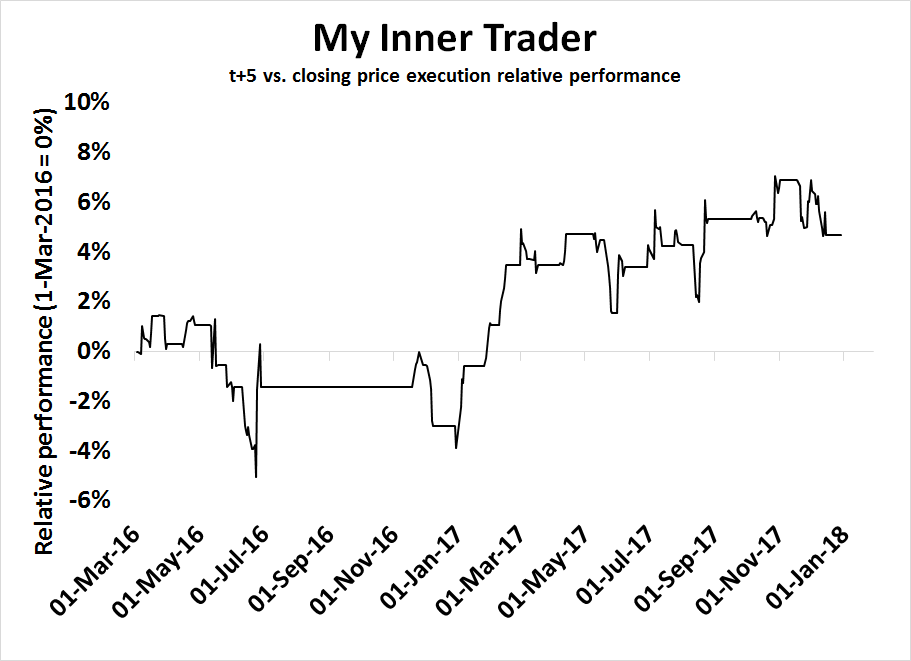
This analysis indicates that the trading system is most effective as for swing trading, and it is not good at exact market timing. This is roughly the result I expected in light of my previous reservations about publishing returns (see From alpha to actual returns: Why your mileage will vary).
My inner trader is giving himself a C+ for the year. The win rate of 87% for the year was excellent, but the absolute return was disappointing. It was hard to time the market when all stock prices did was to go up.
The weeks ahead: As good as it gets?
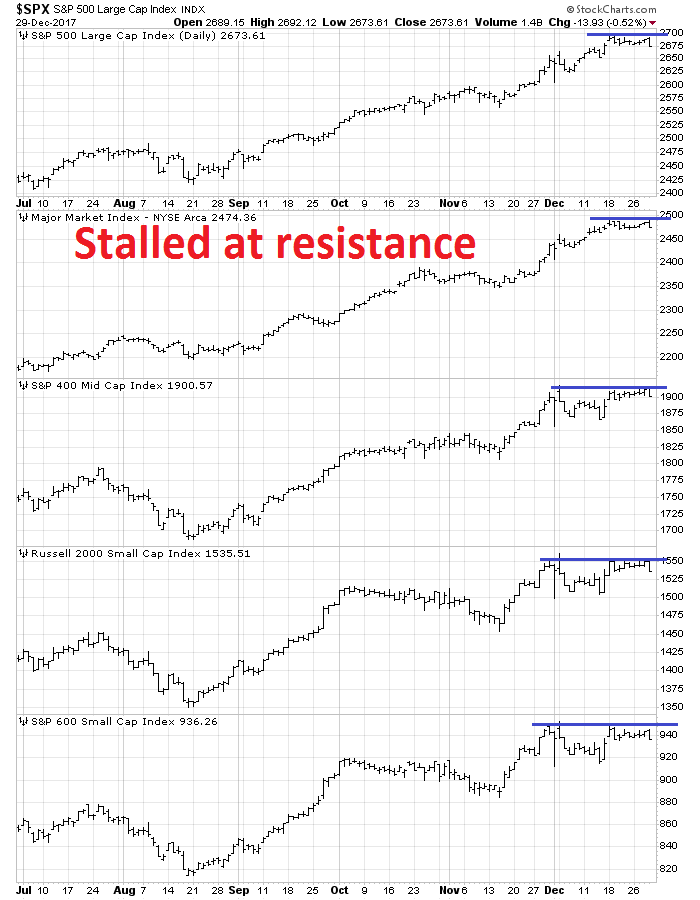
Looking to the weeks ahead, risks are starting to rise after the market rally in December. The inability of the market indices in the different market cap bands to break up through technical resistance is disturbing.
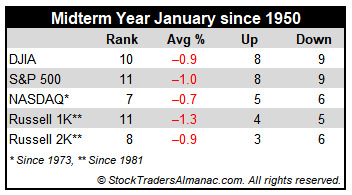
Jeff Hirsch at Almanac Trader observed that equity returns in past Januaries of midterm election years have been less than impressive.
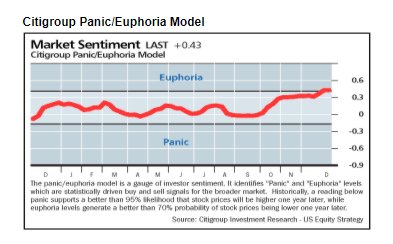
The Citigroup Panic-Euphoria Model is now euphoric, which may limit near-term upside potential.
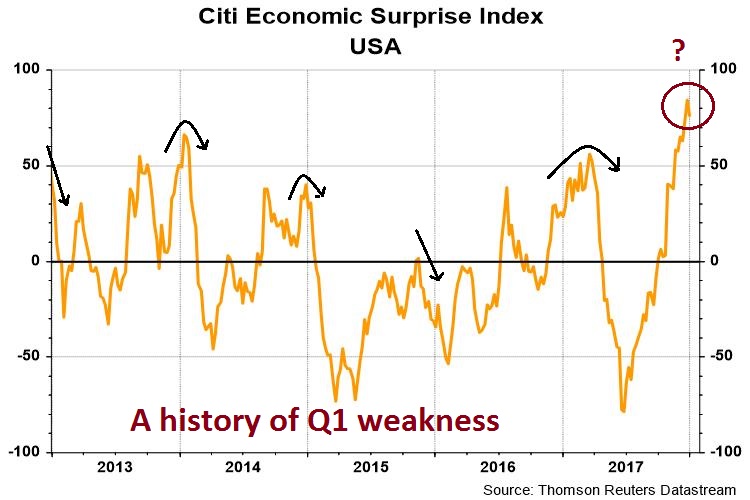
In addition, the Citigroup Economic Surprise Index, which measures whether high frequency economic releases are beating or missing expectations, has shown a seasonal tendency to weaken in Q1.
From a macro perspective, the most likely negative surprise for the markets is an uptick in inflation. As the chart below shows, inflation surprise has been bottoming in every region in the world except for the eurozone.

As inflation surprises have risen, so have market based inflationary expectations. At what point does this spook the bond market, which then depresses stock prices?

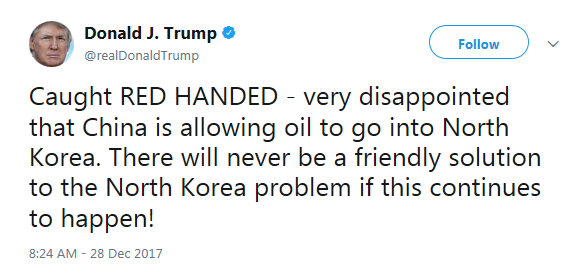
Another possible macro surprise is the prospect of rising protectionism. After achieving the cherished tax cut legislative victory, Donald Trump is likely to turn his sights to his favorite objective of righting the wrongs of “unfair trade”, according to this Washington Post article:
The Trump administration is setting the stage to unveil tough new trade penalties against China early next year, moving closer to an oft-promised crackdown that some U.S. business executives fear will ignite a costly battle.
Several corporate officials and analysts closely tracking trade policy said that President Trump is expected to take concrete actions on a range of disputes involving China within weeks.
Trump is due by the end of January to render his first decision in response to petitions from U.S. companies seeking tariffs or import quotas on Chinese solar panels and washing machines manufactured in China and its neighbors.
Presidential tweets like this one is unhelpful if Trump is determined to punish China on trade.
The Washington Post warned that the magnitude of tariff actions could be a shock to the market:
White House action is due on a separate Commerce Department probe triggered by worries about the national security impact of rising imports of Chinese steel and aluminum.
“Their intent is to bring shock and awe,” said Scott Kennedy, an expert on Chinese trade at the Center for Strategic and International Studies. “They’re not kidding around.”
The macro backdrop may be as good as it gets. Brace for a more volatile market in Q1.
Despite these concerns, both my inner investor and inner trader are giving the bull case the benefit of the doubt. As long as both fundamental and price momentum holds up, neither is ready to turn bearish.
Subscribers received an email alert indicating that my inner trader took profits on his small cap long positions last week. He remains long large caps, but he is starting to get nervous. He may take profits on his remaining long positions next week should either the market or internals deteriorate further.
Disclosure: Long SPXL
2 thoughts on “My 2017 report card”
Comments are closed.
It’s impressive that you consistently made money on your short trades in a year that was up, up and up. I’ve found the downfall of short term traders is digging in their heels when markets do something seemingly irrational like this year when sentiment was so historically high and volatility was the lowest in history. The market seemed ripe for a normal correction so often but it never happened. A trader taking a contrary stand and staying short too often would have been a winner in normal times but not in 2017. That year, you would have lost your shirt.
Congratulations in not doing badly on your short calls in a weird year.
Agreed and thanks for the detailed update, transparency and objectivity.