Mid-week market update: Swing and day traders are often fond of studies that show an edge under certain market conditions. But what happens when two different studies disagree?
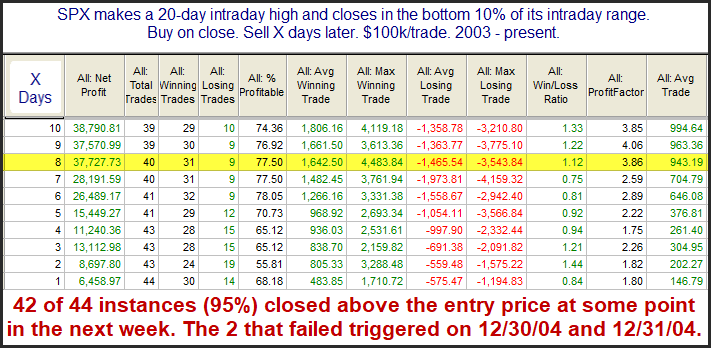
On one hand, Rob Hanna at Quantifiable Edges published a study yesterday that signaled a likely bullish outcome for stock prices. Yesterday (Tuesday) would have day 1 of that study.
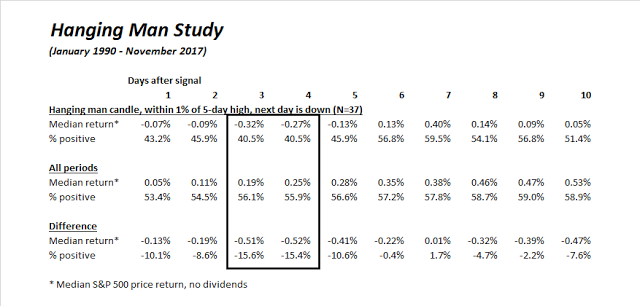
On the other hand, I had identified a hanging man candle on Friday. While hanging man formations are thought of as bearish reversals, further studies showed that they don’t necessarily resolve themselves in a bearish fashion unless there is a bearish follow-through the next day.

When the market opened up strongly on Monday, I had given up on Friday’s hanging man, but the market astonishingly closed in the red to flash a bearish confirmation. My own historical study indicates that these episodes tend to be short-term bearish, and bottom out between day 3 and 4, which translates to either this Thursday or Friday.
How can we resolve this apparent contradiction in market studies?
Market getting oversold
As a quant, I am always cautious about studies that torture the data until it talks. One way of resolving conflicting conclusions is to analyze the market conditions outside the scope of the study.
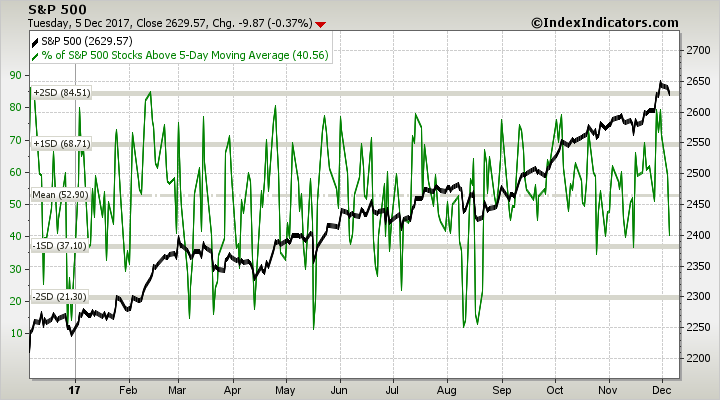
The short term (1-2 day time horizon) charts from Index Indicators show that, as of the close Tuesday, the market was getting oversold.
The long term (1-2 week time horizon) chart also showed that long term trading breadth indicators had fallen dramatically below neutral and closing in on a near oversold reading.
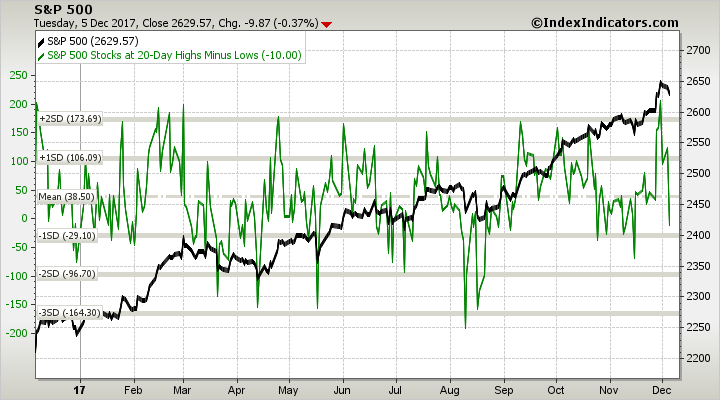
As of the time of publication, Index Indicators has not updated their charts yet. Even though the SPX closed flat on the day, the negative market breadth today suggests that these readings are likely to get worse, which indicates that the bearish impulse may be close to getting played out.
How far will the Tech weakness go?
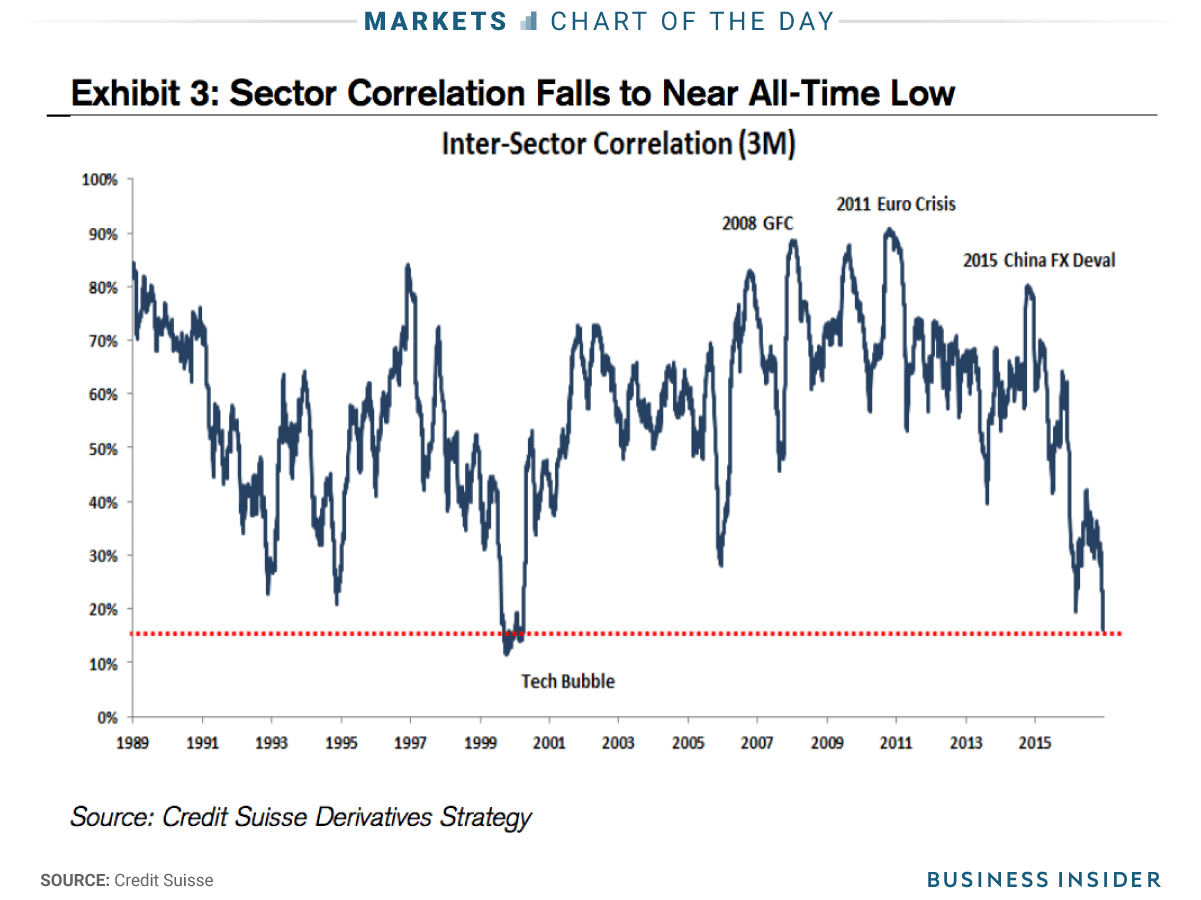
One of the features of the recent market weakness is the selloff in Tech stocks, and semiconductor stocks in particular. One of the other features of the current episode is the rotation of funds into other sectors, such as Financials. Business Insider recently highlighted analysis from Credit Suisse which indicated that sector correlation is at a historical low. These circumstances, where losses in one sector are offset in gains in another, serve to mitigate the losses in the major market indices.
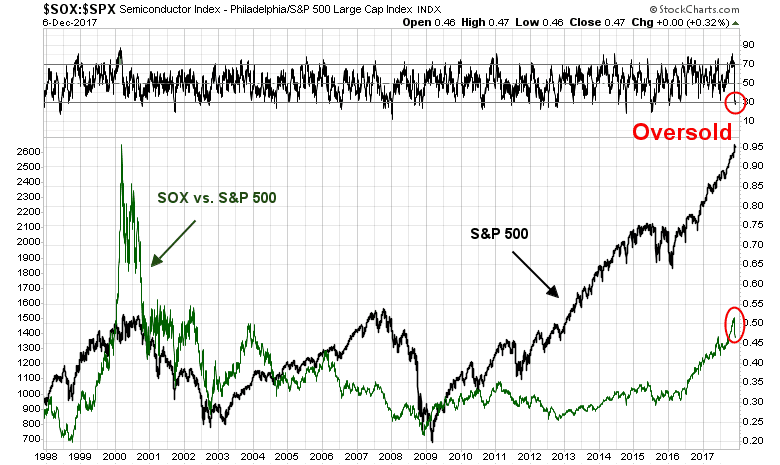
That said, how bad is the Tech and semiconductor selloff and what are the likely outcome when it ends? An analysis of the relative performance of semiconductor stocks shows that they are oversold, and the selling pressure is likely to end soon.
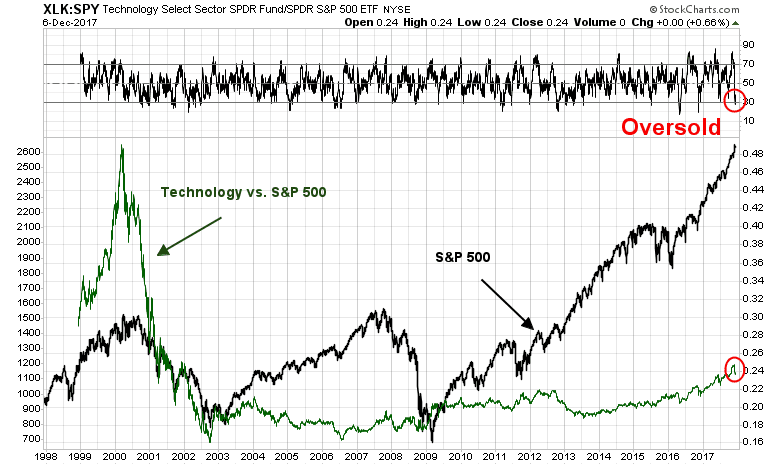
An analysis of the Tech sector shows a similar result.
In connection with the current rotation, Bloomberg highlighted analysis from Andrew Lapthorne of Societe Generale, who believed that the violent reaction in Tech was not just simple sector rotation, but quant factor rotation from momentum into value. As the chart below shows, the relative performance of the price momentum ETF (MTUM) remains intact.
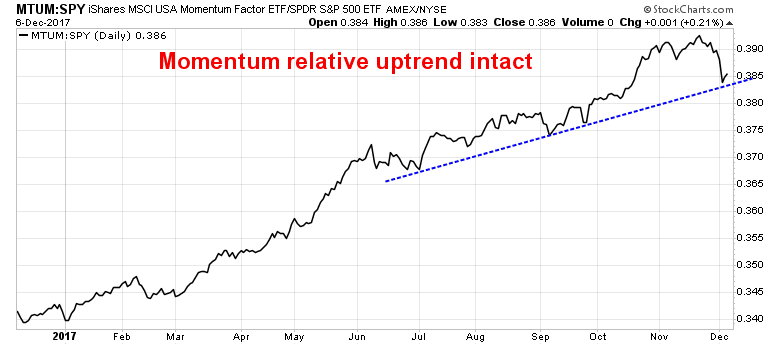
If Lapthorne is correct, and institutional and hedge fund quants are rotating factor exposures, then there is no telling how much further the Tech weakness has to go. I will be monitoring the relative performance of MTUM in the near future. Even though these stocks may see a near term bounce in the days ahead, an analysis of the weekly relative performance of the semiconductor stocks shows that they are not anywhere near an extreme oversold reading on the weekly chart. In the past, whenever the relative RSI has become overbought and mean reverted, the relative underperformance of this group does not end until RSI becomes oversold.

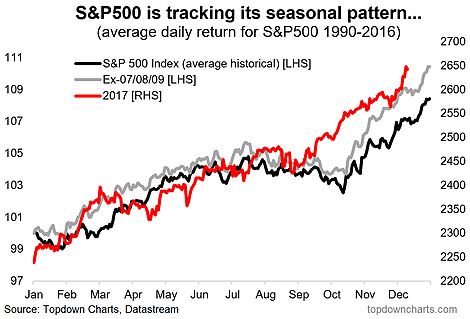
Should Tech start to turn around here, especially with the market mildly oversold, we could see a short-term market bottom in the next few days. This suggests that both studies are correct. The hanging man candle will see a market bottom this week, and the bullish resolution from Rob Hanna’s study will see a temporary market top next week. This is also consistent with the consolidative seasonal pattern identified by Callum Thomas in the early part of December.
My inner trader is short the market, but he is getting ready to pull the trigger and cover his position in the next few days. Stay tuned.
Disclosure: Long SPXU
Thank you for digging a little deeper and analyzing specific sector performance, I believe that looking at sectors within the broader market indices is becoming increasingly important for the next few months at least.