Mid-week market update: After several weeks of waiting, evidence of near-term weakness and consolidation is finally appearing. The SPX violated an uptrend this week and it is undergoing a retreat or a period of sideways consolidation.
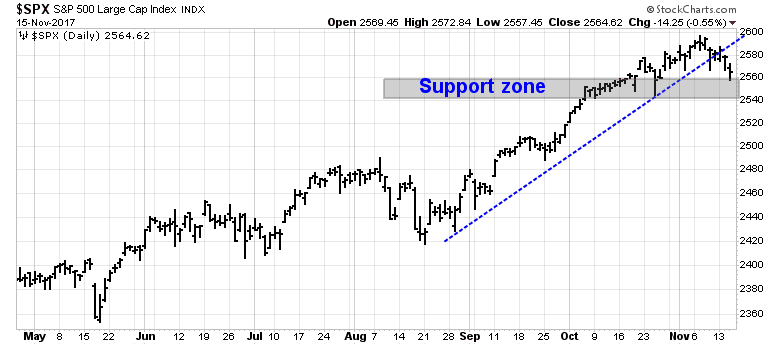
Until today, this orderly retreat in stock prices was enough to depress stock prices, but not enough to flash oversold readings. Today`s decline, however, is beginning to spark oversold readings, indicating that a tradeable bottom may occur in the next few days.
Breadth deterioration continues
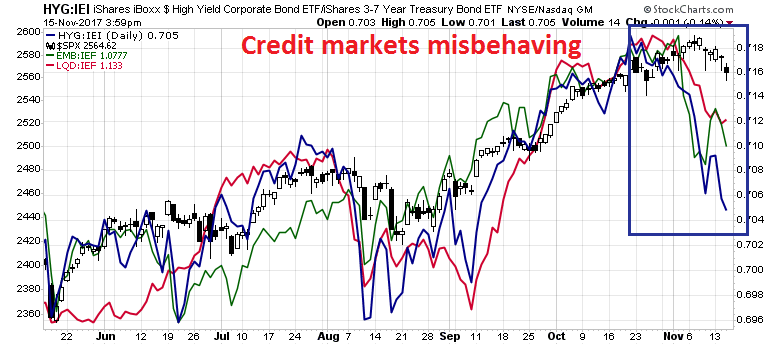
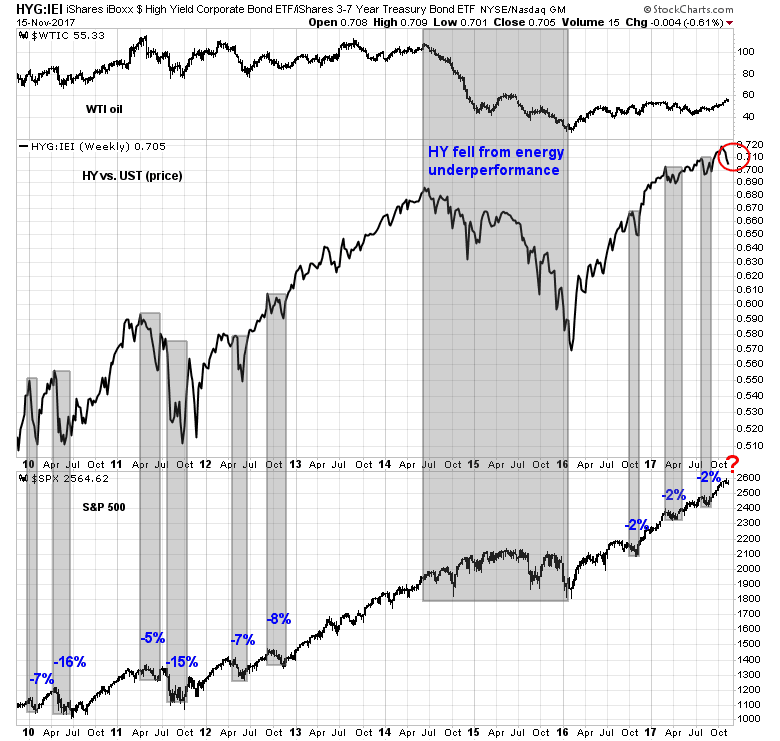
The weakness has been evident for weeks. The deteriorating in breadth and risk appetite that I recently identified are showing few signs of reversal. Credit markets are still performing badly. The negative performance of high yield (HY) against their duration equivalent Treasuries (blue line), EM bonds vs. UST (green line), and investment grade bonds vs. USTs (red line) are still headed downwards.
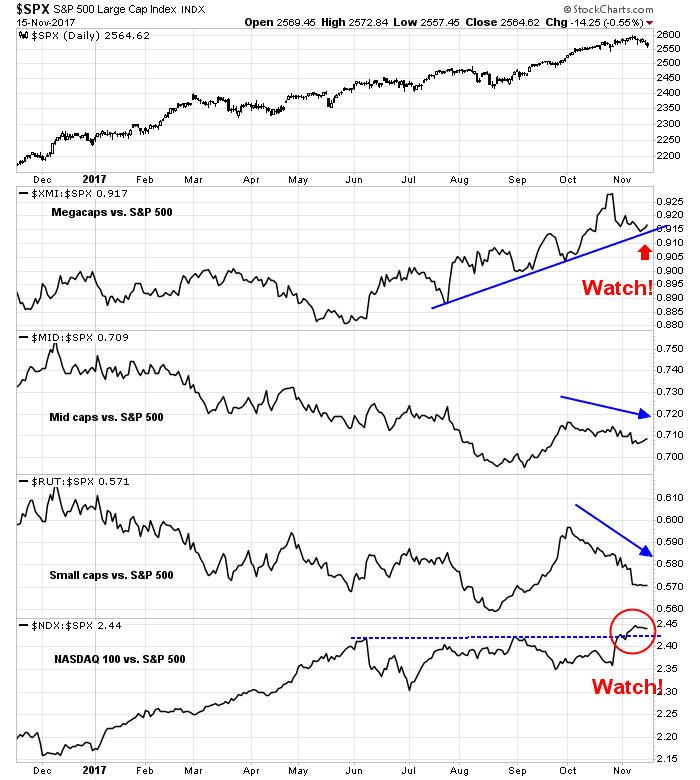
Small and mid cap stocks continue to underperform, indicating poor breadth participation. Leadership is restricted to just a few megacaps and large cap NASDAQ stocks.
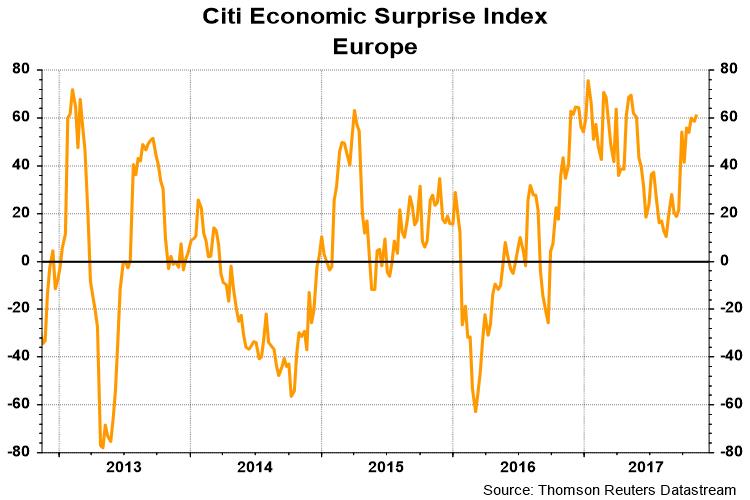
The rise in risk aversion is spreading to Europe. Both the Euro STOXX 50 and FTSE 100 recently fell below their 50 dma, indicating a loss of momentum.
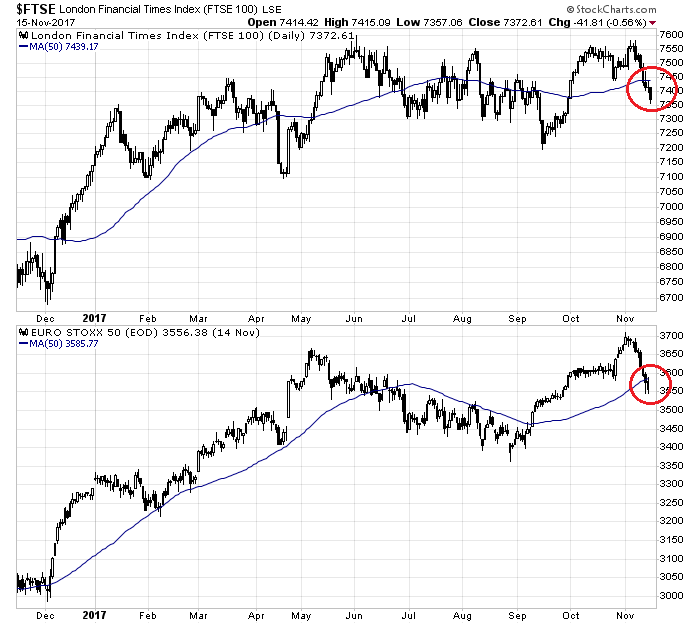
The poor performance of eurozone equities is particularly surprising in light of their recent positive macro surprises.
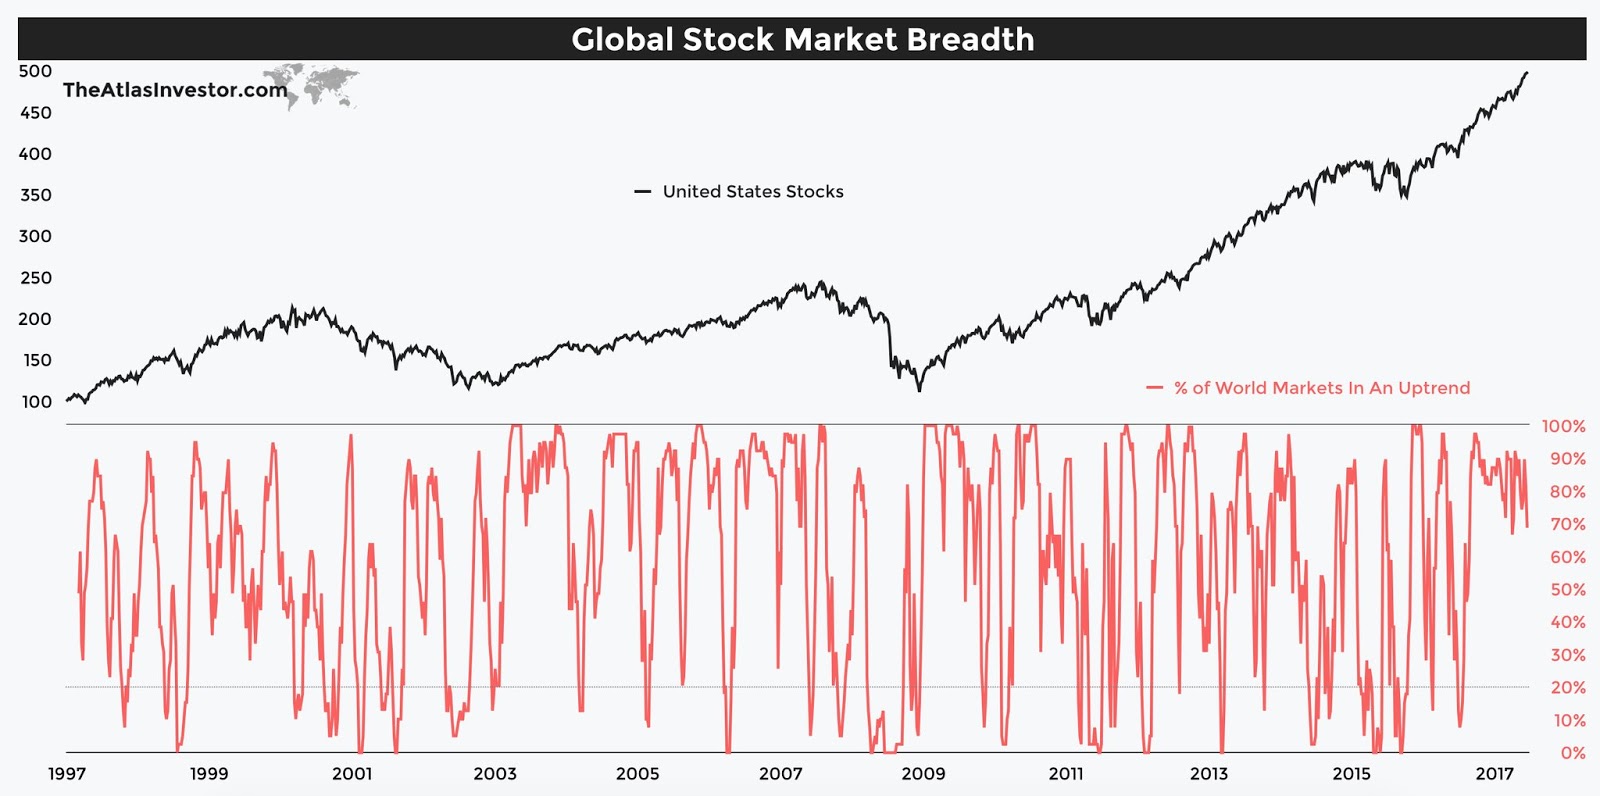
Tiho Brkan confirmed my observation about non-US market breadth by pointing out that global breadth is deteriorating.
Commodity prices are also falling, based on signs that Chinese economic growth may be coming off the boil. In particular, the cyclically sensitive industrial metals has fallen below both its uptrend line and its 50 dma.

Getting oversold
Some of the short-term lines that I outlined on the weekend where I would cover my short position have been crossed. RSI-14 has fallen to 50 or less. The VIX Index has risen above its upper Bollinger Band, indicating an oversold condition.
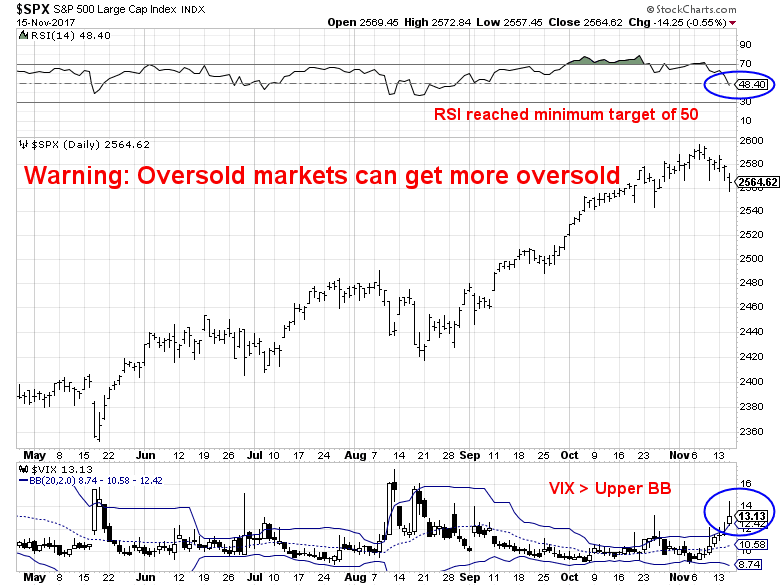
At the time of this writing, the Fear and Greed Index has not been updated since Monday night, and it is unclear whether it has fallen to the minimum target reading of 40. (In response to a reader comment, these are all minimum readings indicating that the market has fallen sufficiently to cover a short, and they are not necessarily buy signals, as oversold markets can get more oversold).
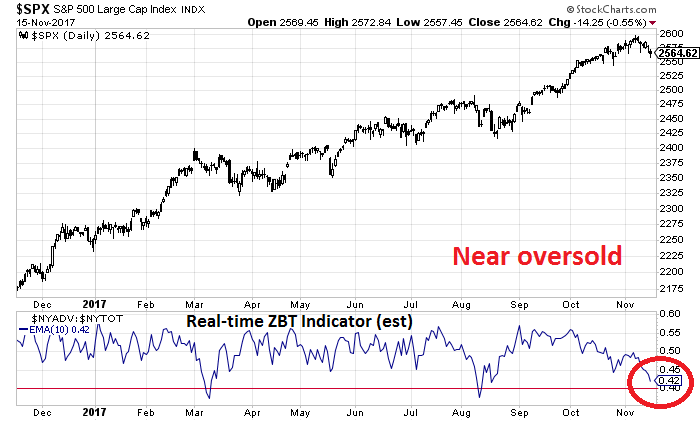
Interestingly, the Zweig Breadth Thrust Indicator is nearing an oversold setup, which could be indication of a brewing buy signal. Readers who want to follow this indicator in real-time can use this link.
As a way of estimating near-term downside risk, I went back in time for eight years and looked for past occurrences of negative HY negative performance to see how far down equities fell after such episodes. The early instances of poor HY relative returns saw the SPX experience drawdowns of 5-15%. The 2014-16 period can be discounted because HY was affected by the specific underperformance of energy related companies. Since then, HY underperformance has been relatively shallow, and SPX drawdowns were in the order of 2%. If the market were to see a 2% peak-to-trough decline, then that would put the SPX downside risk at around 2540.
Don`t get too bearish
Despite my short-term bearish bias, my intermediate term outlook remains bullish. I have already outlined the many signs of bullish intermediate term momentum last weekend (see The tax reform jitters correction?) so I would repeat them.
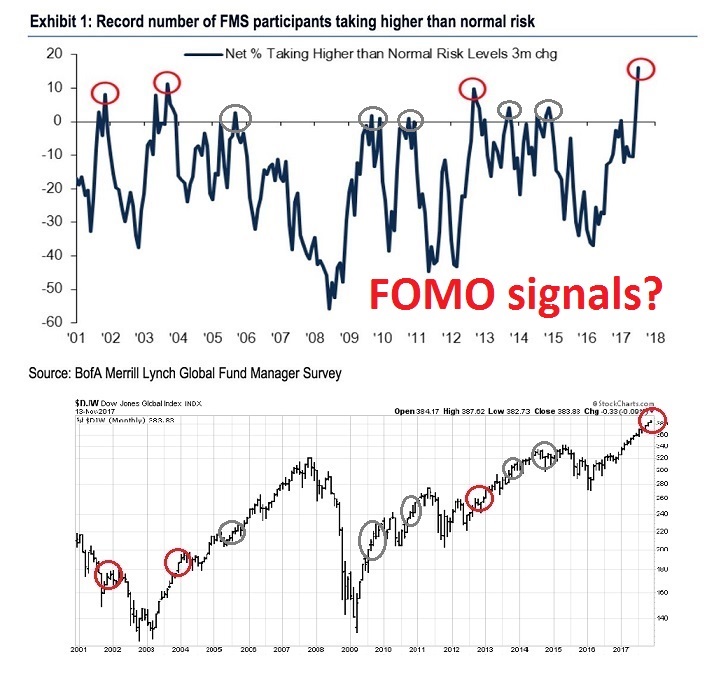
I would point out, however, that the release of the latest BAML Fund Manager Survey contained a number of surprises. Upon first glance, fund manager positioning indicating a stampede into risky assets may prompt a reflex interpretation of these readings as a contrarian sell signal. Upon closer examination, however, the historical evidence suggests that these bullish excesses are the first indications of a FOMO (Fear of Missing Out) melt-up. (I have annotated less extreme buy signals in grey, which are also consistent with market advances, not tops).
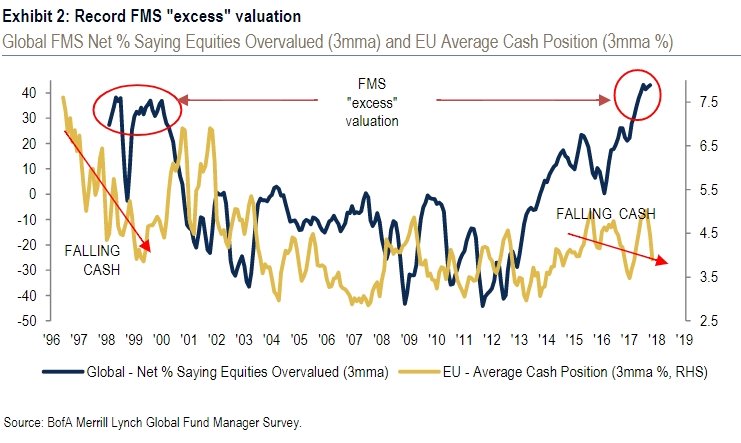
As well, the historical record shows that excessive valuation and risk appetite can take some time to resolve itself in a bearish manner. Similar levels of perceived excessive valuation and falling cash levels began to appear in 1998, which was well before the NASDAQ peak in early 2000.
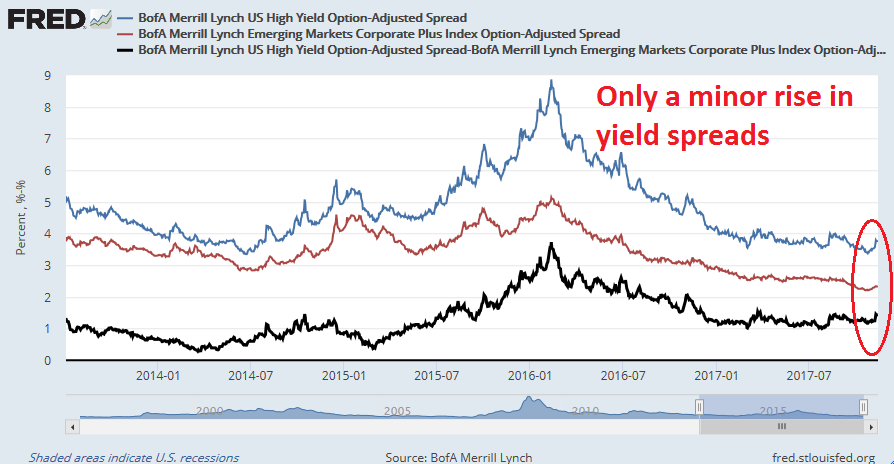
What about the back up in yield spreads touted by Gundlach and others? Here is some context of the “blow out” in spreads. Bottom line: it’s a trading call warning and not a sign of the Apocalypse.
Don’t stay bearish too long. The melt-up may be just around the corner.
Disclosure: Long SPXU
1 thought on “An orderly retreat, but getting oversold”
Comments are closed.
The correction may be bigger than expected only because there’s been no 3% dip for almost a year.