It is said that while bottoms are events, but tops are processes. Translated, markets bottom out when panic sets in, and therefore they can be more easily identifiable. By contrast, market tops form when a series of conditions come together, but not necessarily all at the same time.
I have stated that while I don’t believe that the stock market has made its final cyclical top, we are in the late stages of a bull market (see Risks are rising, but THE TOP is still ahead and Nearing the terminal phase of this equity bull). Nevertheless, psychology is getting a little frothy, which represent the pre-condition for a major top. This is just another post in a series of “things you don’t see at market bottoms”. Past editions of this series include:
- Things you don’t see at market bottoms, 23-Jun-2017
- Things you don’t see at market bottoms, 29-Jun-2017
- Things you don’t see at market bottoms, bullish bandwagon edition
- Things you don’t see at market bottoms, Retailphoria edition
- Things you don’t see at market bottoms, Wild claims edition
- Things you don’t see at market bottoms, No fear edition
- Things you don’t see at market bottoms, Paris Hilton edition
As a result, I am publishing another edition of “things you don’t see at market bottoms”.
CFO sentiment: 83% believe market to be overvalued
A recent Deloitte survey of Chief Financial Officers (CFOs) found that 83.1% believe the equity market to be overvalued, which is the highest level in the history of the survey. To be sure, CFO sentiment is an inexact market timing indicator, as this reading has been elevated for some time.

Leveraged loans are back!
The WSJ reported that leveraged loans are back. Issuance in both the US and Europe are set to top pre-crisis levels.

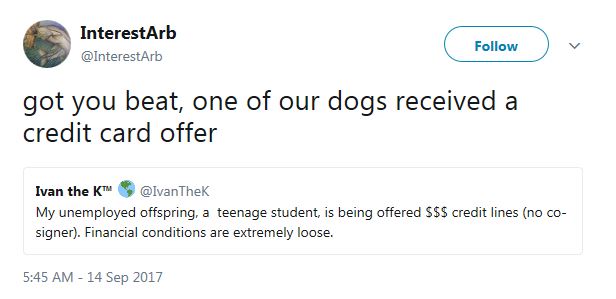
As an example of how credit standards have fallen, unemployed teenage students and dogs receive credit card offers.
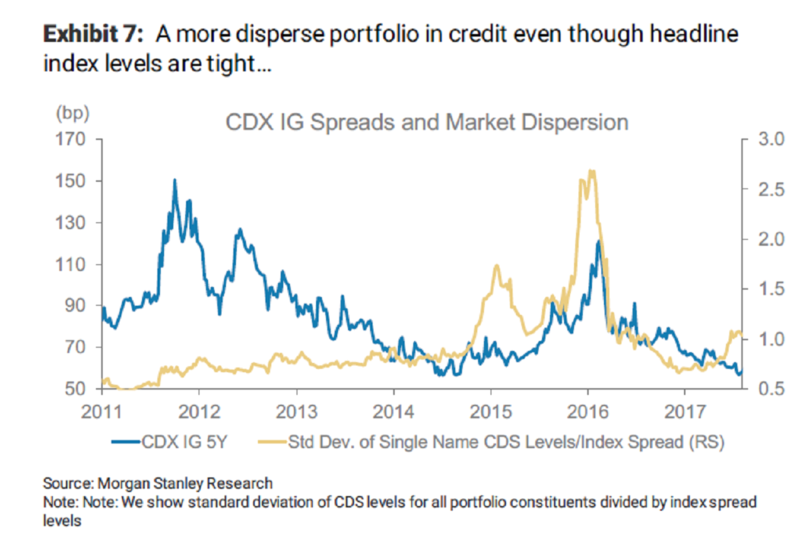
To be sure, the Toys “R” Us bankruptcy filing was a warning for investors who have stretched for yield. This apparent appetite for risk has depressed credit spreads to historically low levels, but trouble is brewing beneath the surface. Bloomberg highlighted analysis from Morgan Stanley indicating that the dispersion of credit spreads is rising, even as headline spreads have fallen.
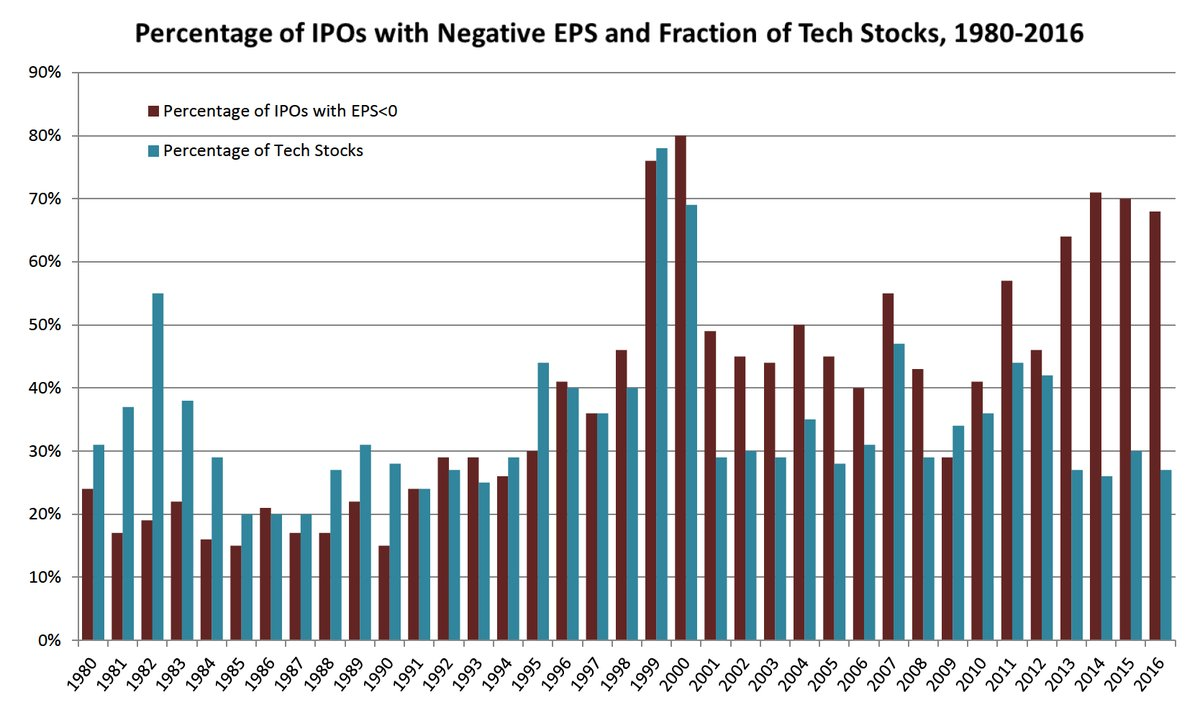
Unprofitable IPOs are rising
As experienced investors know, market psychology is constantly oscillating between fear and greed. Today, the percentage of IPOs with negative earnings has only been eclipsed by the period preceding the NASDAQ Bubble top. Is this a manifestation of fear, or greed?
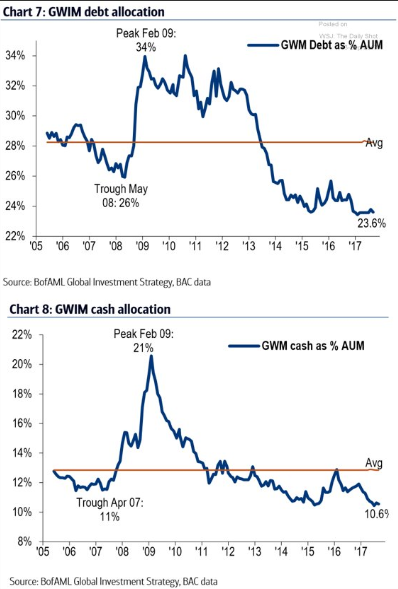
BAML also recent reported that private client bond and cash allocations have fallen to historically low levels. Is this fear, or greed?
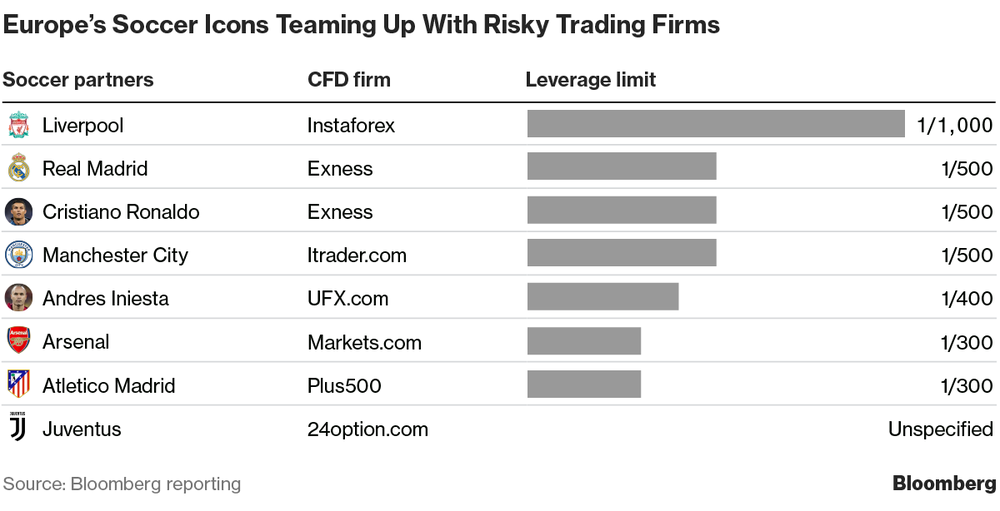
Cristiano Ronaldo, CFD spokesman
Finally, I see that Real Madrid star Cristiano Ronaldo is promoting Contract For Difference, or CFD, trading.

For newbies, CFDs are lightly regulated or unregulated derivative contracts that allow for leverage of anywhere from 300:1 to 1000:1. Bloomberg reported that a number of European soccer clubs have partnered with CFD firms.
For now, I believe the frothy excess that I cited in this and past report represents a “this will not end well” narrative without an obvious bearish trigger. However, sentiment doesn’t function well as precise market timing tools. BAML strategist Savita Subramanian pointed out that the last year of an equity bull can be rewarding and can be painful to miss.

Now if only I could achieve that 1000 to 1 leverage in that final bull leg…
Cam, I don’t understand Subramanian’s point. It seems to be it is the blinding glimpse of the obvious, which is perhaps why you used the tongue-in-cheek reference with respect to leverage. Anytime one stands at a peak one would likely find that the returns over the prior year were quite good (they certainly wouldn’t be negative), and indeed one would feel quite pained for having missed it.
Using my mediocre excel skills it took me all of three minutes to find that when the S&P 500 is at a 52-week high its average price return over the prior year was right in line with those observed by Subramanian. (Obviously, the big market peaks in Subramanian’s universe are a subset of the 52-week highs in mine). The average return (includes overlapping observations) was 20.4% and the median return was 19.1% Add in a reasonable dividend assumption and these results match Subramanian’s findings. My dataset starts in 1950, so if one excludes the two Subramanian observations prior to that then a generic 52-week high may on average produce higher prior 1-year returns than the big market peaks do. Let’s call it a tie.
By the way, if the S&P closes in early November at its current level it will be up 20.3% in price terms from its year earlier level. Add in about 2% points for the dividend yield and we are right in the ballpark for normal 12-month returns prior to a big peak. Would Subramanian say the top is in?
Bruce
Your point is well taken. That said, Savita Subramaniam is trying to imply that the top is ahead of us, or that is my understanding.
When the rate outlook cooled this summer,I was willing to forgive the high optimistic sentiment and not reduce equity weighting. But now that Yellen has turned hawkish and sentiment has gone from optimistic to bubbly so I’ve entered stop orders on QQQ and FDN. Proceeds will go to the S&P 500 Inverse ETF (SH). Because they represent a 15% weighting, the swing to short represents a 30% reduction in equities for growth clients from 60% to 30%.
The last time I was this low in equities (after I get stopped out) and long an inverse was spring of 2008.
This time my concern is only about bubbly high sentiment not the economy. If we get a correction and a shift in investor sentiment to pessimism, I’ll ramp up exposure gladly.
Ken
Thanks for the update. That is a steep reduction in equity exposure, at a time when there is a “risk on” feel to the market.
Cam, did I miss a trade, or are you still long SPXU?
Robby
Even I was wondering the same as you. That said, Ken’s reduction in equity exposure is in lock step with Cam’s SPXU position.
Still short the market 🙁
More details coming up in this weekend’s writeup.
Thanks, Cam.