Preface: Explaining our market timing models
We maintain several market timing models, each with differing time horizons. The “Ultimate Market Timing Model” is a long-term market timing model based on the research outlined in our post, Building the ultimate market timing model. This model tends to generate only a handful of signals each decade.
The Trend Model is an asset allocation model which applies trend following principles based on the inputs of global stock and commodity price. This model has a shorter time horizon and tends to turn over about 4-6 times a year. In essence, it seeks to answer the question, “Is the trend in the global economy expansion (bullish) or contraction (bearish)?”
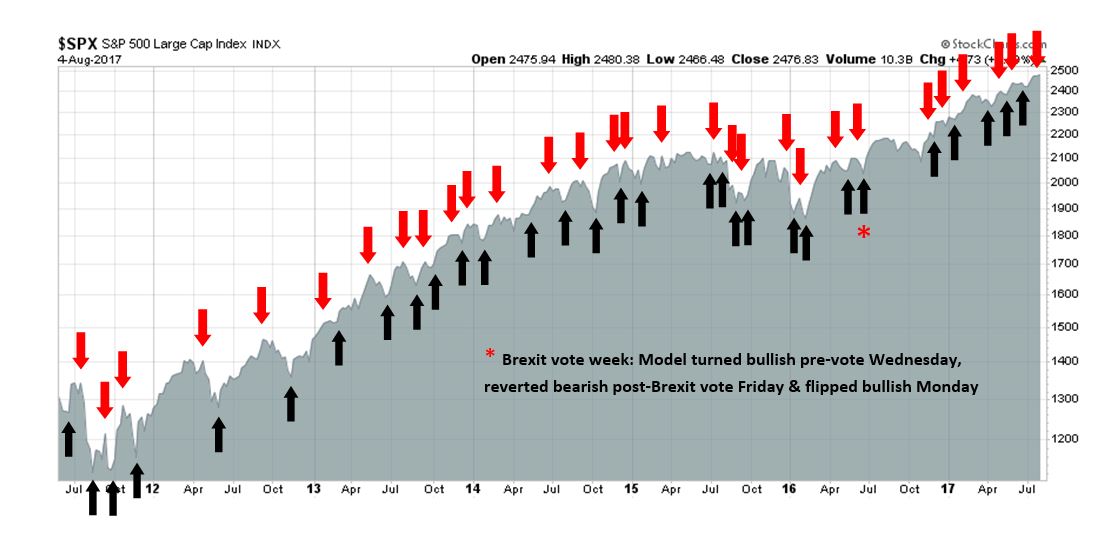
My inner trader uses the trading component of the Trend Model to look for changes in the direction of the main Trend Model signal. A bullish Trend Model signal that gets less bullish is a trading “sell” signal. Conversely, a bearish Trend Model signal that gets less bearish is a trading “buy” signal. The history of actual out-of-sample (not backtested) signals of the trading model are shown by the arrows in the chart below. Past trading of the trading model has shown turnover rates of about 200% per month.
The latest signals of each model are as follows:
- Ultimate market timing model: Buy equities
- Trend Model signal: Risk-on
- Trading model: Bearish
Update schedule: I generally update model readings on my site on weekends and tweet mid-week observations at @humblestudent. Subscribers will also receive email notices of any changes in my trading portfolio.
A late cycle market
Bloomberg recently published an article, Why a little economic overheating won’t spoil the market rally, that featured the views of Nomura strategist Kevin Gaynor:
The “Goldilocks” rally still has juice.
That perfect environment to sustain broad market gains — when global growth is fast enough to lift corporate profits, but tame enough to keep inflation muted — should be in effect for at least another 12 months, according to Kevin Gaynor, the head of international economics at Nomura Holdings Inc.
As the business cycle reaches its climax, European stocks, high-yield bonds and emerging-market credit have the potential to catch up with valuations notched in the halcyon days before the 2008 financial crisis, he said.
“We could get a more extended market rally,” Gaynor said in an interview. “When labor markets are tight and economic growth operates above trend, you see corporate profitability dropping, and that’s one reason to get bearish. For now, we aren’t seeing that type of margin pressure.”
I agree 100%. The nowcast shows that initial jobless claims, which has shown a remarkable inverse correlation with stock prices, is pointing to a robust economy.

For investors and traders, the trick is to spot the turning point. Here are the bull and bear cases for stock prices.
The bull case
Arguably, the stock market is in a sweet spot. Rates are low, and rising very slowly at a controlled pace. Growth is positive and non-inflationary. Core PCE, which is the Fed’s preferred inflation metric, remains tame.

The deceleration in inflation rates is not just confined to the US, but it’s a global phenomena.

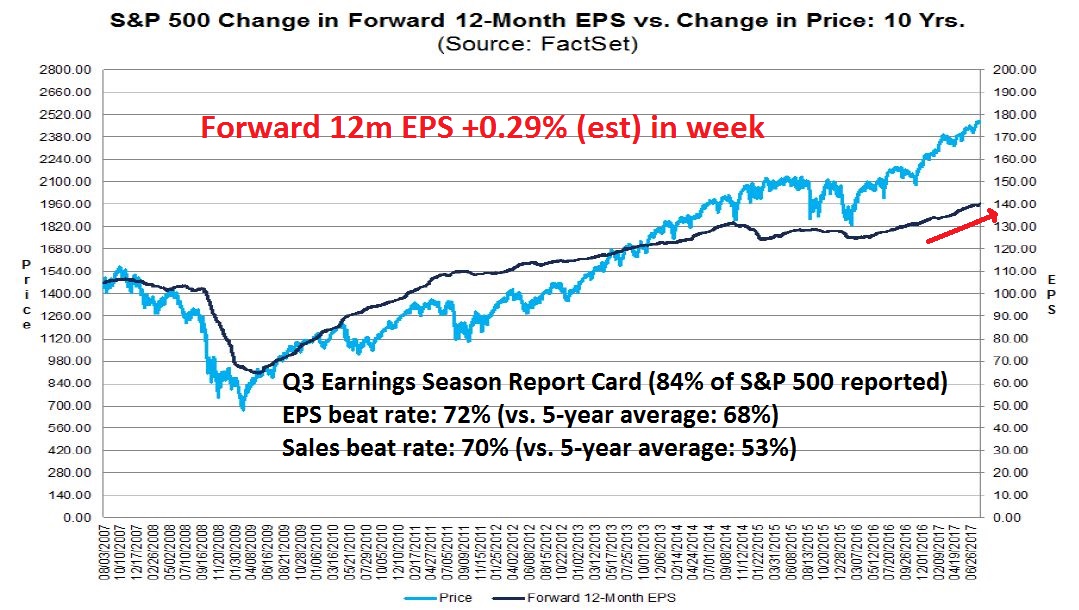
The latest update from FactSet shows that Q3 Earnings Season is showing blowout results, and forward 12-month EPS continues to get revised upwards, indicating Street optimism.
In short, the stock market is enjoying Goldilocks environment (not too hot, not too cold) growth, low rates, and low inflation, which is likely to restrain central bankers from being overly aggressive in raising rates. What more could an equity investor ask for?
Inflation pressure on the horizon
The bad news is the series of negative inflation surprises may be temporary. There are signs of nascent inflationary pressures from both the manufacturing and services sectors, which will force the Fed to raise rates in order to cool the overheating economy.
IHS Markit found that delivery times are getting rising (falling global manufacturing PMI delivery times = longer deliveries), and these supply chain pressures are indicative of capacity constraints that push up input prices.

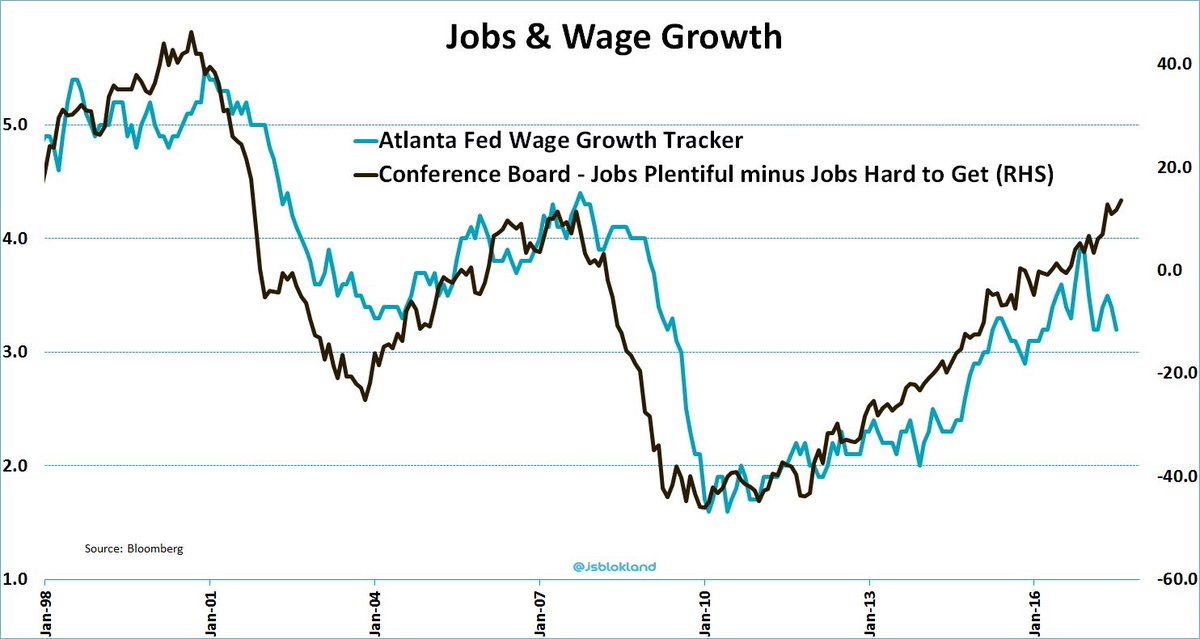
As well, the labor market is showing signs of tightness. The Conference Board spread between “jobs plentiful” and “jobs hard to get” is rising, which is a signal of rising labor supply capacity constraints. This measure has historically led the Atlanta Fed’s wage growth measure by several months.
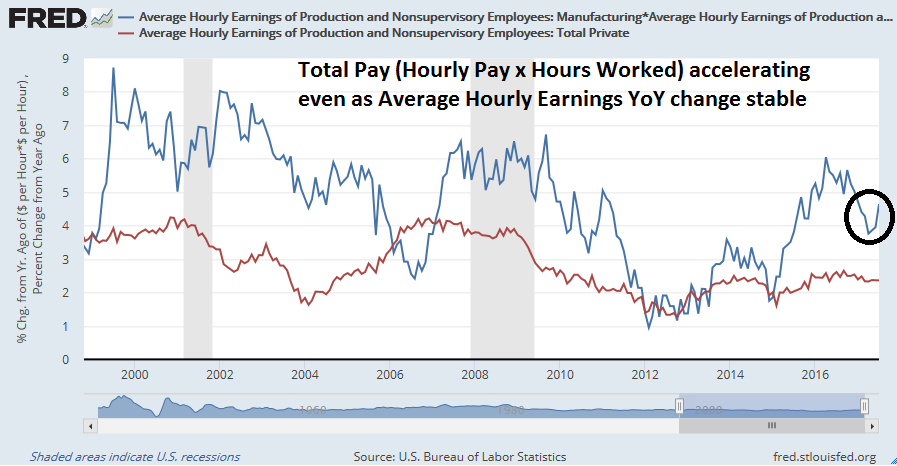
In addition the headline Non-Farm Payroll figure in the Employment Report, one closely watched number is Average Hourly Earnings (AHE) as a sign of wage inflation, which impacts Fed policy. While AHE remained stable at 2.5%, another way of measuring compensation is to calculate total pay using AHE X Hours Worked. As the chart below shows, Manufacturing Total Pay (blue line) is a more volatile data series compared to AHE (red line), but YoY change in Total Pay has begun to accelerate upwards.
Even before any of these nascent inflation pressures appear, Tim Duy’s interpretation indicates that the Fed is set on its normalization path because the risks of falling behind the curve are too high:
The path laid out by the Federal Reserve at the beginning of the year for three interest-rate increases plus the start of reducing its $4.5 trillion balance sheet looks shaky due to the slowdown in inflation. There’s no question that the Fed is nervous about the persistent inflation shortfall. Chair Janet Yellen made note of the issue during her congressional testimony earlier this month.
That said, the Fed will balance the inflation data against the broader economic backdrop of ongoing job growth and easier financial conditions. If the latter two trends continue, policy makers will be hard-pressed to rein in existing rate hike plans even if inflation continues to fall short of their forecasts. The traditionalists at the Fed, including Yellen, retain their fundamental Phillips curve framework. They think it is only a matter of time before the Phillips curve is proved true and sends inflation higher, especially if monthly job growth remains well above the 100,000 level. They do not want to find themselves well below their estimate of the neutral interest rate should inflation accelerate.
Moreover, they have reason to retain faith in their fundamental forecast that inflation will return to target given that financial conditions have eased, not tightened, in response to the Fed’s four rate hikes in this cycle.
The CME‘s implied market expectations of a December rate hike stands at just under 50%, which sounds low to me. An upward adjustment of rate hike probability would likely spook stock and bond prices.

A possible policy mistake
That said, the Fed’s normalization path is raising the risk of a policy mistake. Current market expectations call for the Fed to begin reducing the size of its balance sheet in September, followed by a possible December rate hike. CNBC highlighted analysis by Michael Darda of MKM Partners of the historical risks of balance sheet reduction. Five of the past six episodes have ended in recession:
Over the past several months, the Fed has prepared markets for the upcoming effort to reduce the $4.5 trillion it currently holds of mostly Treasurys and mortgage-backed securities. The balance sheet ballooned as the Fed sought to stimulate the economy out of its financial crisis morass.
The Fed has embarked on six such reduction efforts in the past — in 1921-1922, 1928-1930, 1937, 1941, 1948-1950 and 2000.
Of those episodes, five ended in recession, according to research from Michael Darda, chief economist and market strategist at MKM Partners. The balance sheet trend mirrors what has happened much of the time when the Fed has tried to raise rates over a prolonged period of time, with 10 of the last 13 tightening cycles ending in recession.
Central bankers are in uncharted waters. In the past, real money supply growth has turned negative ahead of previous recessions, However, past episodes of negative money growth have also coincided with rising M1 velocity (Velocity= GDP/M1). The current expansion cycle has been characterized by relentless falling M1 velocity, which is an indication of a liquidity trap. The Fed can push money into the economy by raising M1 and M2, but the liquidity injections are not showing the same effects as they have in past cycles.

Central bankers are about to embark on a grand monetary experiment. What happens when they normalize monetary policy even as velocity falls?
A weakening consumer?
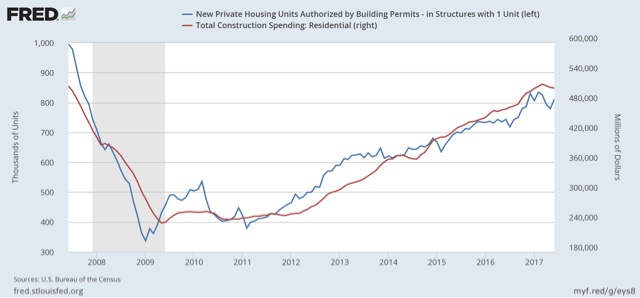
Even as the Fed continues on its normalization path, there are signs that the economy is weakening. New Deal democrat recently fretted about softness in consumer durable, namely autos and housing. Auto sales seems to have peaked for this cycle, though arguably some of the decline could be attributable to the “sharing economy” and the rise of services like Uber.

Housing, which represents a significant consumer durable good and a highly cyclical part of the economy, appeared to have peaked as well.
At the same time, FT Alphaville raised some questions about the resilience of consumer spending. To be sure, real retail sales remain on a growth path today and it has not peaked yet, which can be an early warning of recessionary downturns.

The internals, however, are not as positive. Incomes are not keeping up with consumption, which indicates that consumers are borrowing to maintain their spending.

This interpretation is confirmed by the falling savings rate.

Is it any wonder why the risks of a policy mistake are rising?
Spotting the inflection point
The big question for investors is, “Where is the inflection point? When should investors start to get cautious about stocks?” An analysis from EconoPic Data is highly instructive. Shiller CAPE is current trading at above 30, which is historically high, and therefore the market faces valuation headwinds as it tries to advance.

Further analysis shows that, as long as CAPE is rising, which indicates multiple expansion, returns have held up well. But investors should get out of the way when CAPE reverses course, which is reflective of multiple contraction, or negative price momentum.

For now, the nowcast of the economy and stock market remains strong. The latest Employment Report shows that temporary jobs, which has led Non-Farm Payroll in the last two cycles, shows no signs of peaking.

The Citigroup Economic Surprise Index is recovering from a very low extreme, indicating that macro data is starting to improve.
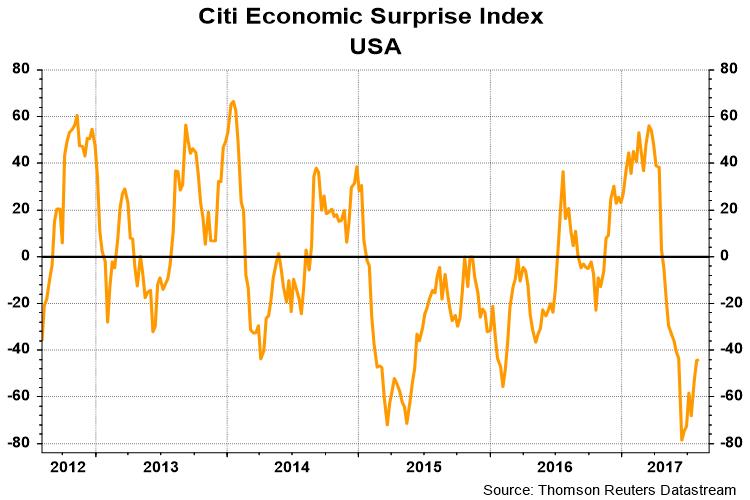
As long as these indicators, along with initial jobless claims, real retail sales, and forward EPS revisions are positive, the risk of a major stock market downturn is low. While the market may appear to be tactically over-extended, any corrective action should be seen as a buying opportunity.
The week ahead
Looking to the week ahead, the SPX remains in a narrow range but I stand by my mid-week remarks (see Bullish exhaustion). The latest analysis from FactSet confirms the analysis by BAML in my Bullish exhaustion post. The market is not rewarding earnings beats but punishing misses:
Companies that have reported upside earnings surprises for Q2 2017 have seen an average price decrease of -0.1% two days before the earnings release through two days after the earnings. This percentage decrease is well below the 5-year average price increase of +1.4% during this same window for companies reporting upside earnings surprises.
Companies that have reported downside earnings surprises for Q2 2017 have seen an average price decrease of -2.6% two days before the earnings release through two days after the earnings. This percentage decrease is slightly higher than the 5-year average price decrease of -2.4% during this same window for companies reporting downside earnings surprises.
The inability of stock prices to rally on good news is a signal that the path of least resistance for stock prices is down. We just need a negative catalyst to trigger a correction.
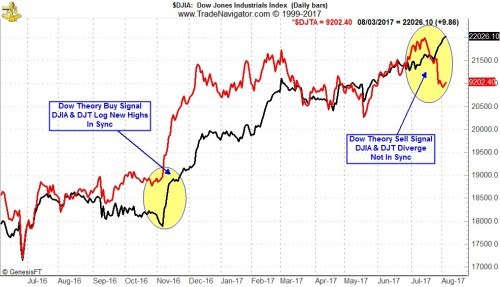
Jeff Hirsch of Almanac Trader also highlighted an ominous Dow Theory Sell Signal that the market flashed on July 26:
Lack of confirmation or synergy between the two oldest U.S. market benchmarks triggered a Dow Theory Sell Signal July 26. When the backbone of our economy that transports goods across the nation does not perform well it is an indication that there is underlying economic woe. It is not always right and like everything else it is subject to interpretation, but it does have a solid track record and is worth heeding here as our other indicators are pointing to a summer selloff around the corner…
These Dow Theory Sell signals take some time to pan out, but the recent history suggests that usual selloff and low following a Dow Theory sell signal may be on its way shortly. After experiencing a typically strong post-election July VIX is still low but turning higher. Sentiment is high and stocks are higher, so the time seems nigh for the August-September slide.
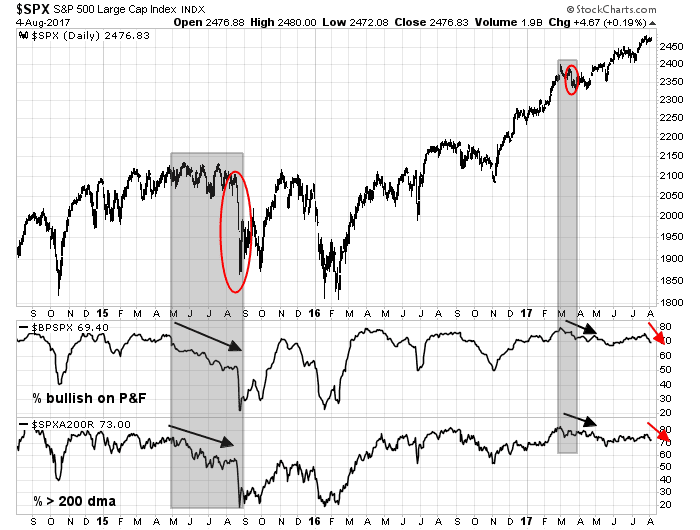
Negative breadth divergences are also flashing warning signals. Both the % bullish and % above the 200 dma are falling, while the market has been flat. The last two times this happened, the market resolved itself in corrections.
My inner investor remains constructive on stock prices. Recession odds remain low, and therefore so is downside risk from a major bear market. My inner trader is positioned for a corrective episode of unknown magnitude. He is just waiting for the bearish catalyst to surface.
Disclosure: Long SPXU
We are now 18 months from the last 5% plus correction in the S&P 500. On average there is normally two in that time period. They don’t need reasons. They just happen in good and bad markets.
The most important factor in understanding the economy and stock market today is what I call the Moonless Economy and Moonless Stock Market.
Fortunately we have a proof of the concept right now. Yes, a true proof that is happening that cannot be anything other than Moonless-ness.
First a brief recap. As a thought experiment, imagine the Moon circling earth causing the tides. Then imagine an asteroid hitting it and it spinning far away into space. The oceans would no longer have tides. Many folks that don’t understand how tides are made would be confused.
Now picture the Central Banks as causing the economic tides in past business and stock market cycles. Their raising and lowering of interest rates caused recessions and booms along with bear and bull markets. The whole economy would have simultaneous recession. This is particularly true of interest sensitive industries like auto and housing. As Cam highlighted above, experienced observers are now expecting autos and housing to both turn down in ‘late cycle’ fashion. We are expecting the tides to go out.
But, evidence shows we are in a Moonless economy where Central Banks do not cause rates to rise enough to cause a simultaneous recession. This is because globalization and the digital revolution is causing inflation to stay below Central Bank target ranges and wage gains to be moderate.
A Moonless economy means that industries can have their own unique business cycle quite different than other parts of the economy. Stocks in those industries can also have their own bull and bear stocks markets independent of the general market averages. A good example is the mining and energy industries having their own recession/depression in 2014-2015 while the rest of the economy and the general U.S. stock market did not experience a bear market.
That commodity example can be talked away citing any number of excuses but I want to give you a proof that we are in a Moonless economy and Moonless Stock Market that cannot be denied. Here are the two industries and after my explanation there is a stock chart showing how their stock prices are diverging as proof.
As Cam stated above, the auto and housing industry statistics are starting to turn down in classic ‘late cycle’ fashion. If history is a guide, when the Moon was still in orbit, the Fed raising interest rates will cause a simultaneous recession in both industries and the stocks of companies in them. This will lead to a general recession in the overall economy and a bear market. A famous economist once said, “The housing market IS the economic cycle.” I see this ‘late cycle analysis’ written in so many places recently. It is THE key plank of stock market cycles in determining where were are in the economic and stock market cycle.
When David Rosenberg wrote about these ‘late cycle’ auto and housing trends a few months ago, I challenged him by saying that I expected them to diverge incredibly going forward with housing booming as autos plunged. Why, because in a Moonless economy all industries can have their own cycles and these two industries had differing fundamentals.
The U.S. auto cycle was starting a massive pullback. After recovering from the huge simultaneous GFC in 2008-2009, the industry went far beyond filling the postponed demand by giving sub-prime credit at cheap interest rates to people that shouldn’t have received it. This has led to too many cars sold and now skyrocketing loan defaults and falling used car prices. There is a recession starting in the U.S. auto industry. Share prices of GM and Ford are in a bear market.
Now let’s look at the housing industry. Sure, recent sales and starts have softened a bit but the industry fundamentals are very good. Sales are short because inventories of new houses are too low not like the auto industry where inventories are bloated. Household formation in the key first home buying age group is rising as these folks get jobs and higher wages. Home prices have been rising but show no signs of a boom in most areas that needs to be cooled out. Bank credit policies have if anything been rather tight not loose. They have room to be more generous in giving mortgages. Lastly, the key 30 year Treasury bond rate that the long term mortgage rate keys off of is showing signs of not rising as forecasters feared. So the fundamentals of the housing industry are much better than the auto, in fact, quite bright.
Here is the chart (click on the link) comparing the two industry’s stock performance that I sent to David on April 25, 2017 (vertical red line on the chart). On that day, the Auto ETF was outperforming the Home Builder’s ETF by about 3% in the previous nine months (my momentum look back standard). As of Friday, the Homebuilder’s has outperformed the Autos by 20%. That’s a 23% difference in three months.
https://product.datastream.com/dscharting/gateway.aspx?guid=31cf205f-1eef-4634-9898-d8bf2f92fea2&action=REFRESH
That is why I say, “Knowing that we are in a Moonless Economy and Moonless Stock Market is key to investment performance.”
There is a key behavioral economic phenomena called Confirmation Bias where we humans try to find proofs of ideas they currently have and flaws in new ideas. For example, economists and investors are keying into the direction of interest rates to prove that we still have a Moon that will turn the tides of the whole economy and stock markets sooner or later. Sure the direction of the interest tide is rising but the extent is pitiful. I remember when rates in 1987 went up over two percent from spring to autumn. The current quarter percent hikes that we sweat over are a ripple compared to previous tsunamis. You’re likely thinking of other proofs of why the Moon is still there. How many bull/bear cycles within individual industries as the general market chugs along on a even keel, do you need before you see the Moonless World? Face it, we are Moonless. The only ‘late cycle’ or ‘early cycle’ we have to worry about is in an individual industry not the whole economy or the whole stock market. The auto industry is in a dangerous early recession point and housing is at a mid-cycle sweet spot. Those two used to be joined at the hip cycle after cycle. Think about it.
@Cam & @Ken: Great observations and opinions as always.
@Cam: My bullish confirmation bias would point me to the opinion that the reduction in balance should have little effect if there really is a liquidity trap. I keep hearing the saying that there’s too much money at the bank. I don’t know how true that is in the practical sense and how it contributes to the liquidity trap-like situation we’re in.
Ken
Thanks for explaining the idea of a “moon”. I would like to suggest considering a “multiple moon” analogy. Each sector or industry has its own “moon” if I may. The “many moons” is because of globalization. US Fed has become one moon amongst many that “respond” to tides.
Multiple moons, connotes each sector’s labor supply and demand and also sales (the product) of that sector. All of that has become globalized, hence the idea of sectorial recessions. The idea assumes underlying labor slack and accommodative central bank(s).
That said, arguably, inflation is what ties the hands of the US fed, into raising interest rates. Based on the Phillips curve (see excellent articles by Cam on this), we could be at the cusp of inflation, however, this time one may need to see even lower unemployment to trigger inflation. Goldman Sachs recently suggested 3.8% as unemployment rate, much lower than where we are currently, before unemployment bottoms out and inflation kicks in.
Underlying these ideas is the deep and troubling debt overhang that Central banks have created.
The whole idea of raising and lowering interest rates to stimulate or reduce demand in the economy has become a wrong idea. Go down the list of the 100 components of the inflation index and ask yourself if consumers would buy more or less depending on interest rates. Food? Restaurants? Legal Services? Medical Services? Drugs? On and on. The only two you would say a resounding YES to are autos and homes. There the level of interest rates have a big impact. Therefore, it’s my recommendation that one should gauge the appropriate level of interest rates in the economy by their impact on those two sectors. In America, auto sales have been very strong while home sales are consistent and on an even keel generally with pockets of strength. That tells me, rates could be higher without hurting the general economy.
Canada is a different story of our Central Bank incorrect interest rate policy. Our interest rates have been far too low for too long and it’s caused a record setting boom in auto sales and a bubble in housing. While these two industries were booming, the government was concerned about the sluggishness of the rest of the economy and low inflation so kept rates too low. But as I said above, the rest of the economy doesn’t respond to lower rates. The important energy business was in decline because of global factors. The manufacturing due to productivity problems. Now they are raising rates just as the housing bubble it starting to crash. That looks eerily like the ending of the U.S. real estate bubble when the Fed raised rates into 2008 as housing was already into a severe decline.
I expect U.S. housing to continue strong since interest rates are too low. The only thing holding it back are memories of the crash during the GFC. As memories fade and consistent home price increases continue, the sector will do well. The only time we need to worry about the Fed raising interest too high to hurt the economy is when they are high enough to cool home price increases. The rest of the economy doesn’t care about interest rates.
But what about businesses, doesn’t the level of interest rates stimulate or reduce profits since they owe so much money? Won’t this have them borrowing or not to build new plant and equipment?
The answer is a theoretical yes and a reality big NO. Economists live in the theory but let’s look at the reality. Corporate bond yield spreads have widened and lowered by three to six percent (BBB to C) over the last few years as investors first worried about credit problems and then were no longer worried. Why then should investors worry about the base Treasury riskless rate going up by slow quarter point increments over the next couple of years? That’s a fly on the elephants back.
Ken
Interesting take on interest rates and auto and housing sectors being the most responsive to such moves. Yes, in the domain of non-revolving credit/longer term loans that sounds plausible.
I quote from your missive; “But what about businesses, doesn’t the level of interest rates stimulate or reduce profits since they owe so much money? Won’t this have them borrowing or not to build new plant and equipment?”
You are correct, businesses will borrow more, if interest rates fall. With the borrowed money, yhey will retire old, higher paying debt, with new cheaper debt, if possible (not all bonds can be retired this way). They will buy shares back with that borrowed capital, raise dividends and buy other companies in an attempt to return value to their share holders. The last bull market since the bottom of 2009 proves my point. Would they build new plant and equipment is the question you have asked. Yes, they will build new plant and equipment in parts of the world where there are competitive advantages, like cheap labor. Western countries have, since 2009, built lots of plant and equipment in China, India, Mexico, Philippines and other EMs. This supports my idea of “many moons”. Furthermore, I will submit to you that in the “many moons” economy, US GDP is unlikely to grow, as it did “traditionally” following recessions.
I quote further from your missive; “The whole idea of raising and lowering interest rates to stimulate or reduce demand in the economy has become a wrong idea”.
2/3rds of the US economy is consumer driven. Most of this is run on credit card debt. Do you not think that the Fed lowering interest rates not help such consumers? Credit card interest rates are usually lowered (or raised) based on prime rate, and indirectly to Fed funds rate. So where are these credit card $s spent? Since this is revolving credit, it is not used to pay auto and housing loans. Most of it is on in the consumer domain (food, gasoline, apparel, shoes, consumables etc. that is 2/3rds of the US economy). Lowering borrowing costs, does line consumer America. Just my 2 cents.
I quote further from your response; “Why then should investors worry about the base Treasury riskless rate going up by slow quarter point increments over the next couple of years”?
Cam has referenced in his articles the complex relationship between GDP growth, unemployment and “real” interest rates. By historic/traditional metrics, what we are seeing are unusual times. Following the 2008 recession, it has taken 9 years to muster 2% GDP growth, give or take. Traditionally, we should have been closer to say 3% growth, give or take. Inflation should also have been higher, based on the current unemployment rate. Yes, Cam shows, that the next shoe to drop here is inflation turning up, and we all wait to see that happen. For now, the jury is out there, whether small rise in Fed funds rates is material or not, in killing the sub par GDP growth we have on our hands. As you indicate, if Fed fund rates are raised slowly, over the “next of couple of years”, economy may dodge a bullet. That is however not the history of what the Fed has done. Furthermore, the Fed is on the throat of the bond market, and their directives have been a series of rate hikes. Whether it happens is another matter, but remains a persistent worry.
My point on rates is that economists are fixated on direction and ignore magnitude.
Credit card interest rates are very high. A quarter point hike by the Fed here and there has no bearing on credit card loan usage.
Why would the Fed try to stimulate demand by hoping that consumers would buy consumable items (movies, coffees, vacations, etc) and accumulate credit card debt? It simply a loan source for dumb people. Credit card debt just compounds until the cardholder stops spending (borrowing from future spending) or defaults.
Again, corporations will not change decisions based on a Fed changing rates by quarter point increments. We see quarter point trading swings in bond markets weekly.
The extent of Fed moves is too small. We are effectively Moonless.
Ken
I quote you: “My point on rates is that economists are fixated on direction and ignore magnitude”.
Sure, size matters (magnitude). 😉 😉 No arguments, lol.