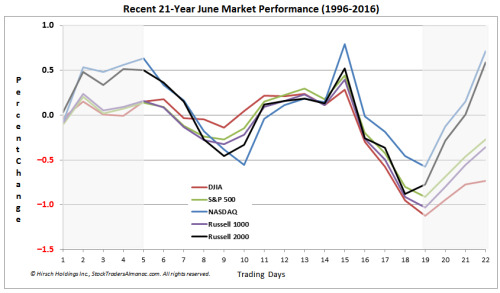
Mid-week market update: So far, the stock market seems to be following Jeff Hirsch’s seasonal map of June. The market was strong in the first couple of days, and it has mostly been flat this week. If history is any guide, it should start to weaken late this week.
Evidence is building that of a volatility spike ahead. As volatility is inversely correlated with stock prices, rising vol therefore implies a stock market pullback. The chart below of the ratio 9-day VIX (VXST) to 1-month VIX (VIX) shows that anxiety is rising, but levels are nowhere near where past corrections have bottomed in the past.
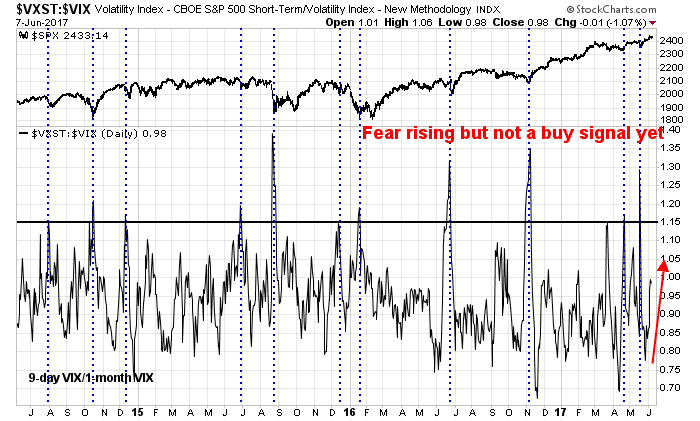
Indeed, there are a number of binary events coming up. Thursday will see the ECB meeting, the UK election, and the Comey testimony before Congress. Next week is the FOMC meeting. No wonder the 9-day VIX is rising.
Tame VIX, but rising anxiety
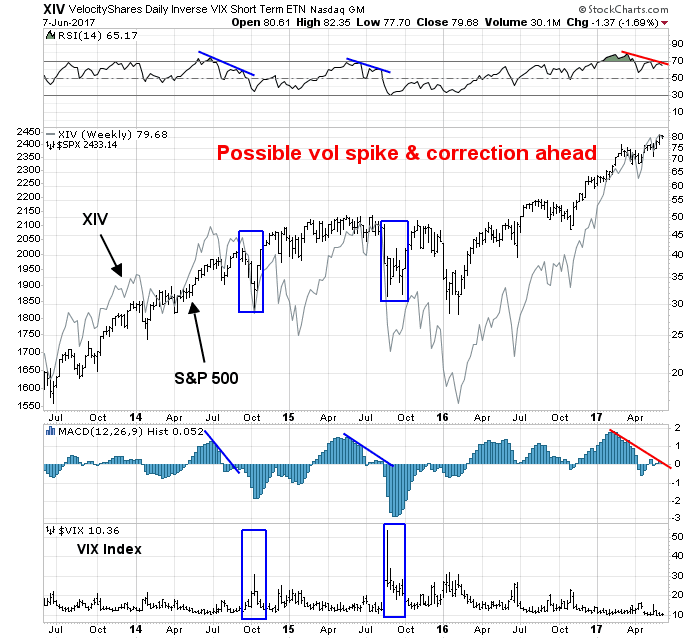
The level of the VIX Index has recently been low and stable, but there are signs of rising anxiety beneath the surface. I am grateful to a reader for pointing out the market internals of XIV, the inverse VIX ETN. As the chart below shows, both the weekly RSI and MACD on XIV are showing the kind of deterioration that have been precursors to short-term stock market corrections in the past.
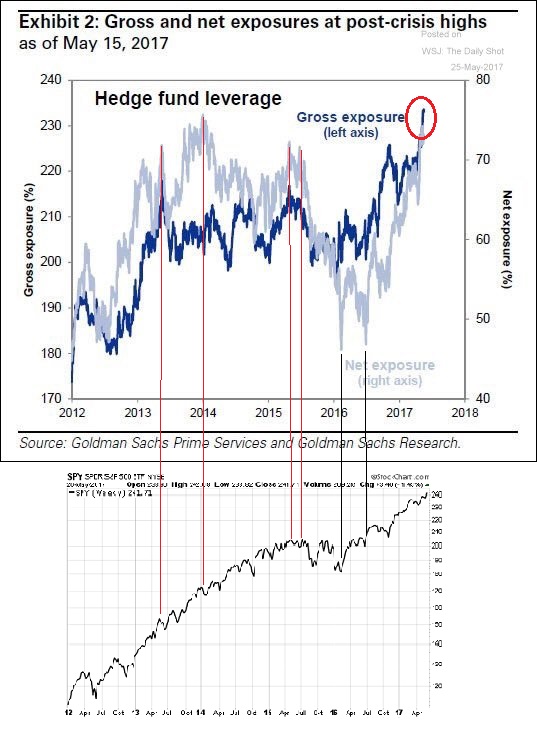
I pointed out before that hedge fund leverage as a measure of risk appetite is at a crowded long level where pullbacks have occurred in the past.
What`s the trigger?
To be sure, none of this means that stock prices have to weaken right away, if ever. These are weekly charts and the time frame of a possible correction is uncertain. However, a possible technical trigger for near-term market weakness was seen this week.
The chart below of the SPX shows that stock prices had recently an episode where the market rallies on a series of “good overbought” reading on RSI-5 (top panel). These “good overbought” signals have been bullish and can continue for some time. However, market advances have stalled when RSI-14 (second panel) pulled back to neutral from an overbought reading, which happened on Monday.
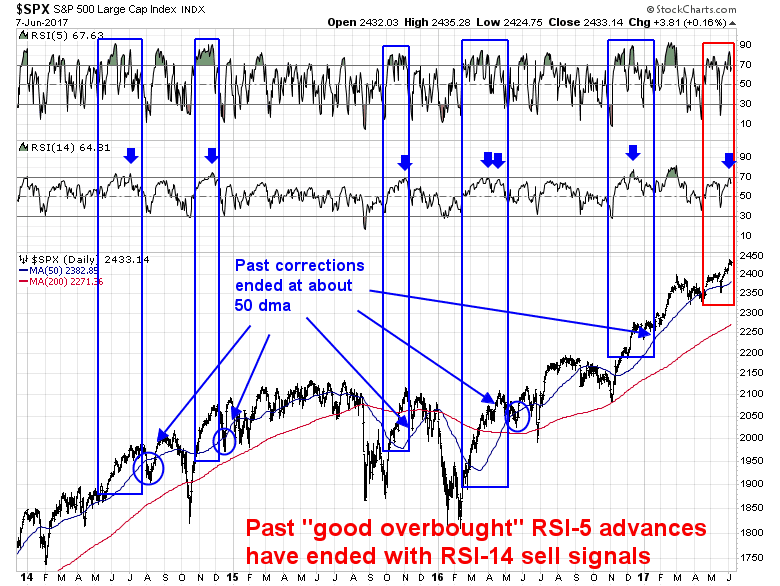
In summary, the weight of the evidence suggests that a pullback could happen at anytime. As the chart above shows, past corrective episodes like these have been halted at or above the 50 dma, which current stands at about 2380, which represents a shallow correction.
My inner trader remains short the market, with an exposure to the high-beta small cap stocks.
Disclosure: Long TZA
Do you mean TZA instead of TNA. ‘remains short the market’ – then why holding TNA?
Charts like Hirsch’s seasonal map of June would be even mopre informative if they showed variance bars. Which of the highs and lows in this chart are outside of the varience range?
looks like a rotation under way, fixed income has been slightly heavy, financials, russel 2000 are rallying and tech heavy. Dodd Frank stuff as well.
Hard mkts to profit from at the moment !