Preface: Explaining our market timing models
We maintain several market timing models, each with differing time horizons. The “Ultimate Market Timing Model” is a long-term market timing model based on the research outlined in our post, Building the ultimate market timing model. This model tends to generate only a handful of signals each decade.
The Trend Model is an asset allocation model which applies trend following principles based on the inputs of global stock and commodity price. This model has a shorter time horizon and tends to turn over about 4-6 times a year. In essence, it seeks to answer the question, “Is the trend in the global economy expansion (bullish) or contraction (bearish)?”
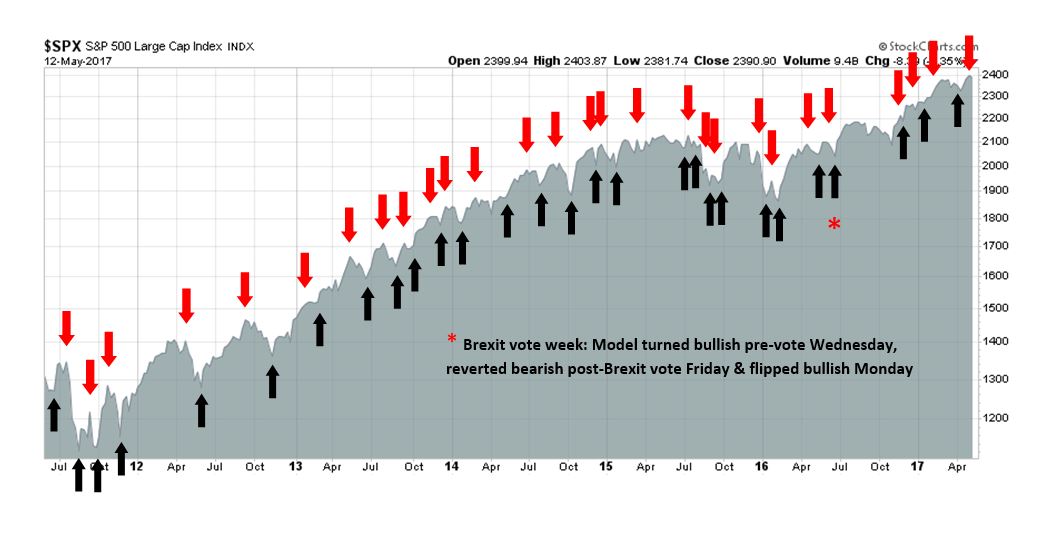
My inner trader uses the trading component of the Trend Model to look for changes in the direction of the main Trend Model signal. A bullish Trend Model signal that gets less bullish is a trading “sell” signal. Conversely, a bearish Trend Model signal that gets less bearish is a trading “buy” signal. The history of actual out-of-sample (not backtested) signals of the trading model are shown by the arrows in the chart below. Past trading of the trading model has shown turnover rates of about 200% per month.
The latest signals of each model are as follows:
- Ultimate market timing model: Buy equities
- Trend Model signal: Risk-on
- Trading model: Bearish
Update schedule: I generally update model readings on my site on weekends and tweet mid-week observations at @humblestudent. Subscribers will also receive email notices of any changes in my trading portfolio.
A maturing bull
This bull market that began with the SPX low of 666 in March 2009 has lasted over eight years. While that may seem like a long time, bull markets don’t just die of old age. Rather, they end as excesses build up and central bankers act to cool down the overheated economy.
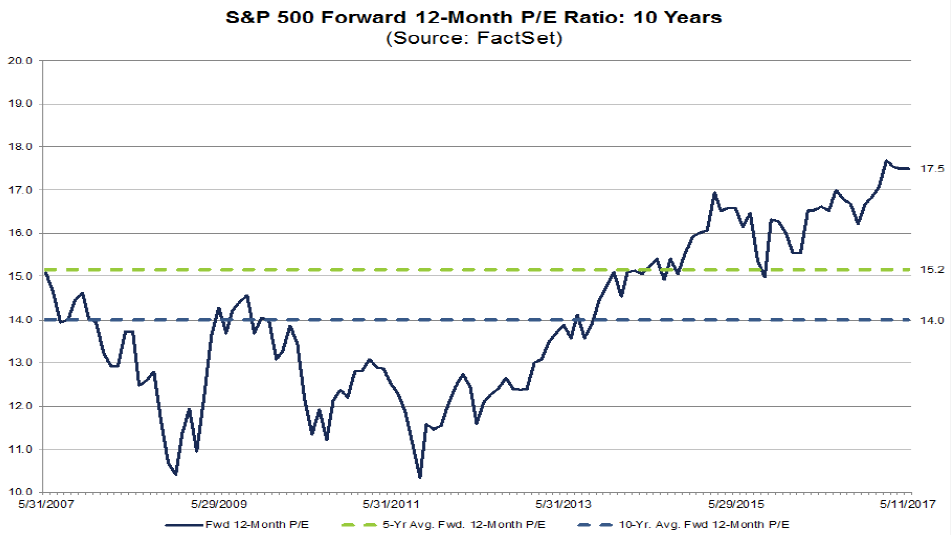
Today, there are numerous signs that this bull market is in its late stages. Valuations are elevated by virtually all measures. The chart of forward P/E from FactSet shows that current forward 12-month P/E ratio is well above historical norms.
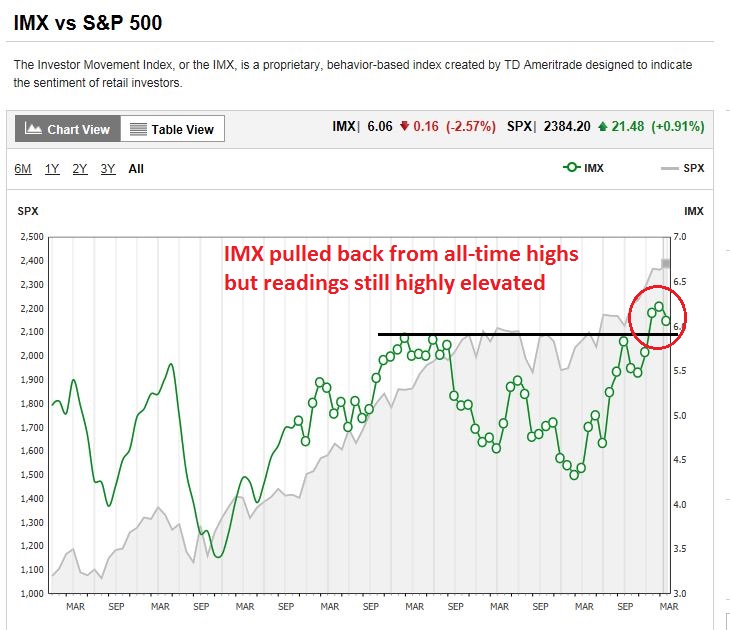
Sentiment is getting frothy. The TD-Ameritrade Investor Movement Index, or IMX, is designed to measure long-term retail investor sentiment. IMX hit an all-time high in March and pulled back in April. Readings are still very elevated by historical standards, indicating individual investor enthusiasm for stocks.
So when does the next shoe drop? The most likely catalyst for a market top is central bank action to cool down the economy. Will a 0.25% hike crash the market? How about 0.50% this year, or Fed action to reduce the size of its balance sheet?
We consider those questions this week.
Elevated valuations
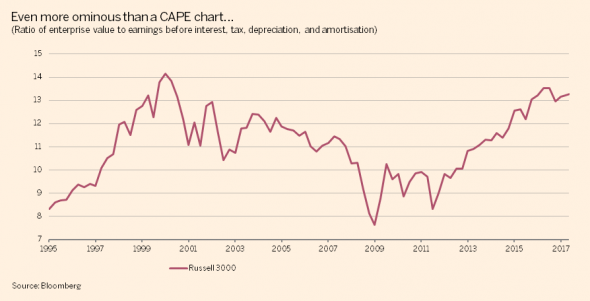
There are many ways of measuring valuation. FT Alphaville recently highlighted analysis from Aswath Damodaran of NYU’s Stern School indicating that EV to EBITDA of the Russell 3000 is at levels last seen during the top of the NASDAQ Bubble. (For newbies, the EV/EBITDA ratio can be best explained as an unlevered P/E ratio, which substitutes equity + debt for P, and earnings plus + interest and taxes for E).
Arguably, EV/EBITDA is elevated because interest rates are so low, but there is an answer for that:
Some attribute these elevated valuations to low yields on government bonds. By this logic, investors should be willing to pay up for riskier assets because the alternatives are so unappealing. The problem, which has been addressed repeatedly elsewhere, is that the assumptions underlying low yields — weak demand, muted pricing power, depressed productivity — imply a challenging environment for businesses. Today’s interest rates could easily justify depressed earnings multiples, if you wanted to make that argument.
Besides, American interest rates more or less hit bottom in 2012. The Federal Reserve has switched from bond-buying to imminent balance sheet shrinkage and raised its policy band by 75 basis points. Real yields on long-term inflation-indexed bonds, which are a better comparison for earnings multiples, are significantly higher now than half a decade ago. None of this fits with the standard theory that companies have mechanically become more expensive in response to developments in the fixed income markets. The likelier explanation is just that US stocks are expensive and future returns will be lower than in the past.
As well, Callum Thomas found that when global markets get overvalued, equity prices tend to pull back. As the chart below shows, the percentage of countries with forward P/E ratios is elevated and at levels where past pullbacks have occurred.
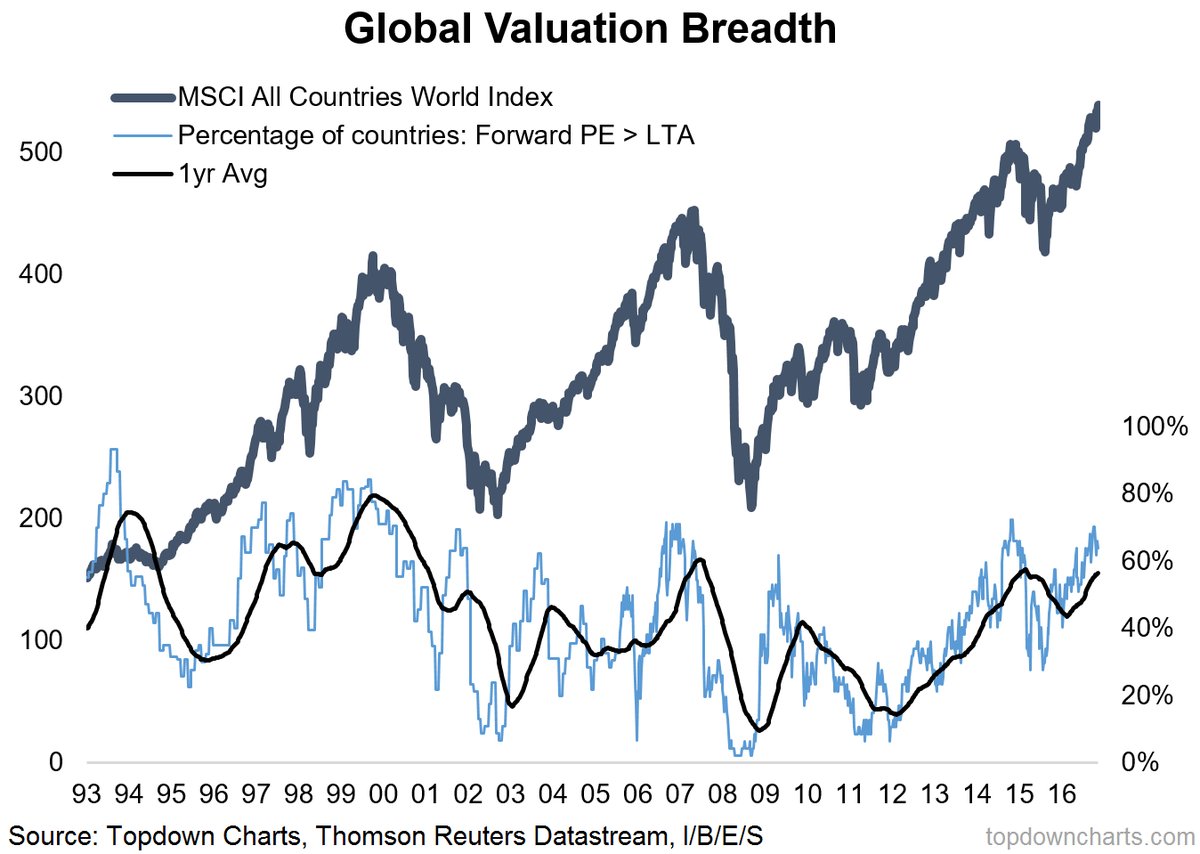
However, valuation has shown itself to be an inexact market timing tool when applied to time horizons of less than 5-10 years. The bull market needs a catalyst for the bull to die.
A frothy market
Excessively bullish sentiment is another pre-condition for a major market top. When a market tops out, we can usually in hindsight point to some anecdotal event that marked a sentiment top. Some examples during the NASDAQ Bubble might be the get-rich-quick tone of online broker TV commercials, or the pets.com sock puppet, as well as evidence of lower and lower quality deals done at unreal valuations.
Today, we have several warning signs:
- The launch of 4X leverage ETFs (via NASDAQ).
- The actor playing J. Peterman from Seinfeld making a TV ad for a high risk IPO that is an aggregator for Uber and Lyft. The pitch is you could make millions like the investors who got in on Uber and Lyft (via Business Insider).

- David Einhorn of Greenlight Capital comparing enthusiasm for Tesla to the heady days of the dot-com bubble: “For the time being, investors remain hypnotized by Tesla’s CEO. They’re skeptical that the company will be able to mass market its model 3 volumes and margins that justify the current valuation. The enthusiasm for Tesla and other bubble basket stocks is reminiscent of the March 2000 dot-com bubble as of the case then, the bulls have rejected conventional valuation methods for a handful of stocks that seemingly can only go up. While we don’t know exactly when the bubble will pop, it eventually will.” (via Avondale)
I could go on, but you get the idea. The party is certainly getting going, is it time for the Fed to come and take away the punch bowl?
The Fed’s change of tone
In response to the punch bowl metaphor, New York Fed president William Dudley recently stated that the Fed is not taking away the punch bowl, but “we’re just adding a bit more fruit juice”. Bloomberg also reported on a Janet Yellen April speech that indicated the Fed’s change of tone:
Federal Reserve Chair Janet Yellen said the U.S. central bank’s task has shifted from a post-crisis exercise of healing the economy to one aimed at holding on to progress made.
“Before, we had to press down on the gas pedal trying to give the economy all of the oomph that we possibly could,” Yellen said Monday in Ann Arbor, Michigan. The Fed is now trying to “give it some gas, but not so much that we’re pushing down hard on the accelerator.”
In other words, the Yellen Fed doesn’t believe that it’s in crisis mode anymore. It’s time to start normalizing monetary policy and not over-react to every hiccup in stock prices.
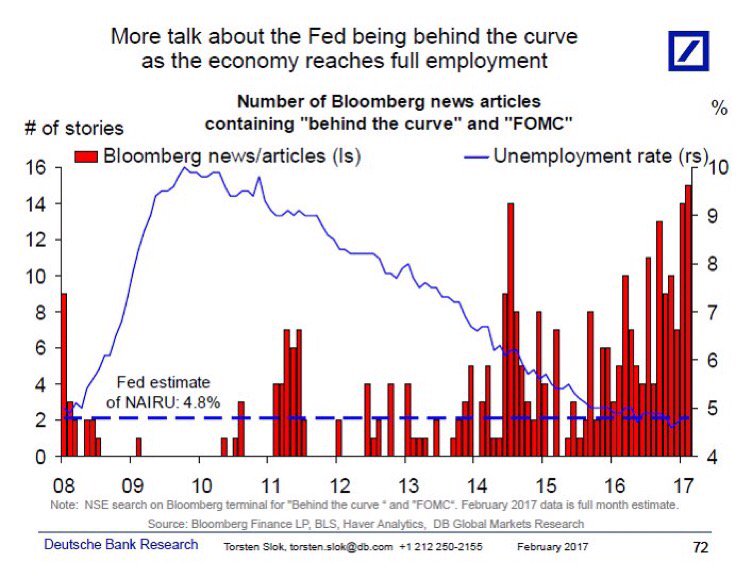
Indeed, pressure is building on the Fed to act. Deutsche Bank highlighted the rising number of “the Fed is behind the curve” stories on Bloomberg news as a measure of the market’s mood.
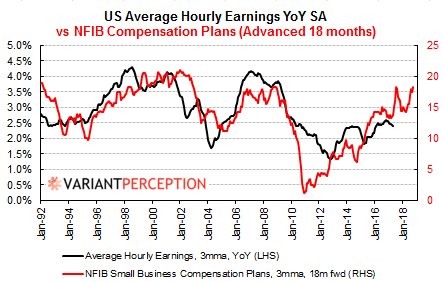
Variant Perception pointed out that NFIB (small business) compensation plans tend to lead average hourly earnings by about 18 months, indicating rising wage pressures, which is certain to push up inflation.
Bearish triggers
Market expectations of a June rate hike is almost a near certainty. But it’s unclear whether a 0.25% hike in June or an additional 0.25% hike later this year can derail this equity bull market.
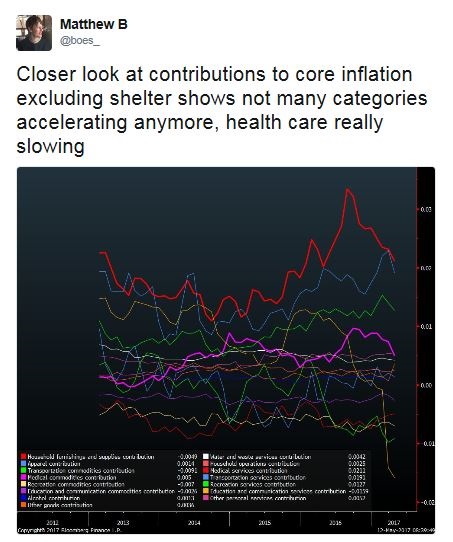
However, there are a couple of likely bearish triggers that may bring the stock market advance to a screeching halt. The first is rising inflation. The Fed has embarked on a course of rate normalization even though inflation has been relatively tame. Last Friday’s April CPI release showed that the components of core CPI ex-shelter have been falling, not rising (via Matthew B). What happens if inflation were to actually tick up?
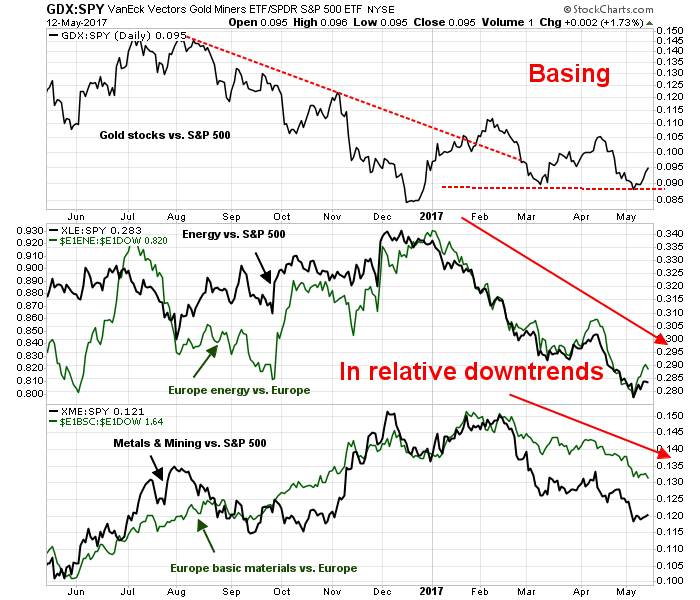
I wrote before that “late phase of the [market] cycle is characterized by tight capacity and rising inflation, which is an environment where asset plays and commodity extraction industries outperform” (see In the 3rd inning of a market cycle advance). I am therefore watching closely the relative performance of inflation hedge sectors such as energy, gold, and mining. Renewed leadership in these stocks will be a sign of rising inflationary expectations, which will be a signal for the Fed to become more aggressive in its monetary policy.
Wait for that signal, but now is not the time. As the chart below shows, the relative market performance of gold stocks is starting to base, but energy and mining stocks remain in relative downtrends.
Unwinding QE
Another possible bearish trigger may be the reduction in the size of the Fed’s balance sheet, which is expected to begin either late this year or early next year. Boston Fed president Eric Rosengren stated in a speech last week that he expects to start the balance sheet unwind after one more rate hike:
Looking ahead, the federal funds rate would obviously exceed 1 percent after one more 25 basis-point increase. In my view, that seems an appropriate point to consider beginning a very gradual normalization of the Federal Reserve’s balance sheet.
Bloomberg reported that William Dudley of the New York Fed echoed Rosengren’s views on the timing of balance sheet normalization:
“We are pretty close to full employment,” Dudley said Thursday while answering questions after a speech in Mumbai. “Inflation is just a little bit below our target of 2 percent if you look at the underlying inflation trend, so clearly if the economy continues to grow above trend we are going to want to gradually remove monetary policy accommodation.”
Dudley and his colleagues on the U.S. central bank’s rate-setting Federal Open Market Committee are on track to raise interest rates twice more in 2017 following a hike in March, marking a significant acceleration in the pace of tightening from the previous two years, as they prepare to start trimming their bloated balance sheet.
“I think if the economy continues to evolve in line with our expectations, sometime later this year or next year we will begin to gradually decide to normalize our balance sheet,” he said.
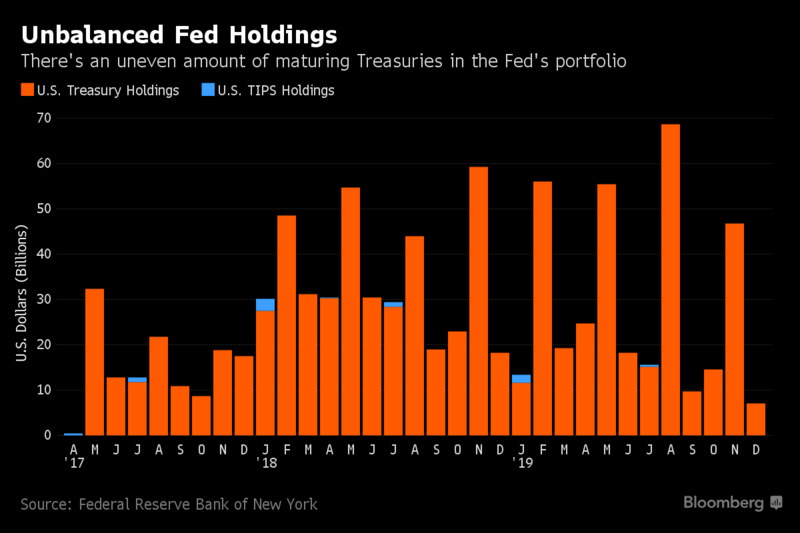
Currently, the Fed is reinvesting all of the coupons and maturing paper as part of their QE program. It is expected that the normalization process would begin with partial reinvestment, and then gradually move to a position where all of the maturing paper and coupons would not be reinvested. Assuming that the unwind program begins in January, the chart of the Fed’s balance sheet holdings below shows that an above average amount of paper begins maturing in early 2018, which could tighten monetary policy more than either the Fed or the market expects.
Raghuram Rajan, former governor of the Reserve Bank of India, spoke at an event sponsored by the Atlanta Fed in which he discussed the challenges of exiting from accommodative monetary policy (video here). Rajan outlined three issues that central bankers face, which I summarize below:
- The reversal of QE effects may be asymmetric, meaning that it may be tougher to get out than to get in.
- Banks may not be able to absorb riskier assets because of more stringent capital requirements.
- Political constraints may force the central bank to unwind faster than may be prudent. Rajan cited the example where rising interest rates would create mark-to-market losses on the Fed’s balance sheet, which would raise uncomfortable questions in Congress. Under such circumstances, the Fed may feel political pressure to unwind the balance faster than originally planned.
In addition, Bloomberg reported that JP Morgan warned that medium sized banks may be forced to merge because of a disappearing deposit base as the Fed unwinds QE:
The company’s investment bankers are warning depository clients that they may begin feeling the crunch in December, thanks to a byproduct of how the U.S. Federal Reserve propped up the economy after the financial crisis, according to a copy of a confidential presentation obtained by Bloomberg News and confirmed by a JPMorgan spokesman…
JPMorgan’s presentation, titled “Core Deposits Strike Back” illustrates how this process will sap bank deposits using the example of a couple who pays off a mortgage that was bundled with other mortgages and sold to the Fed. Right now, when that couple takes that money out of their bank account for that payment, the Fed uses that cash to buy another mortgage bond, recycling it back into the banking system.
A “deposit is destroyed” if the “Fed does not reinvest,” the presentation states.
JPMorgan estimates that a quantitative easing-related deposit-drain could result in loan growth lagging deposit growth by $200 billion to $300 billion a year.That could be particularly problematic for banks that rely on deposit products that tend to roll over swiftly, such as brokered accounts bought from third parties, large commercial banking accounts and high-interest savings accounts for wealthy customers.
QE flooded the banking system with liquidity, but part of the criticism of the program was much of the funds sat around in banks and wasn’t lent out, which diminished the intended effect of encouraging economic activity. Unwinding QE has a leveraged effect of draining liquidity from the banking system, but may hit medium sized banks hard as their deposit base vanishes. It has the potential to create a “bank run” of deposits because of leverage of the fractional reserve system.
There is nothing to worry about for now. Balance sheet normalization is not expected to occur until late 2017 or early 2018. Don’t get too excited until Fedspeak begins to signal its imminent implementation.
Political wildcards: Comey style
The last bearish trigger is a the possibility of political interference in the Fed by the Trump administration. These risks are particularly heightened in light of the Comey Affair.
The Federal Reserve’s independence isn’t unconditional. Pedro de Costa at Business Insider pointed out a provision in the Federal Reserve Act that would allow President Trump to fire Janet Yellen, just as he fired FBI director James Comey.
Political risk has been exacerbated by a number of unusual political statements by Fed officials indicating that the Fed may have gone to war with the White House. Vice chair Stanley Fischer recently pushed back on the Trump administration’s stated desire to “do a number on Dodd-Frank” and defended the Fed’s rationale for financial regulation. In addition, New York Fed president William Dudley made a speech last week extolling the virtues of trade and globalization, which is contrary to the Trump administration’s American First protectionist principles.
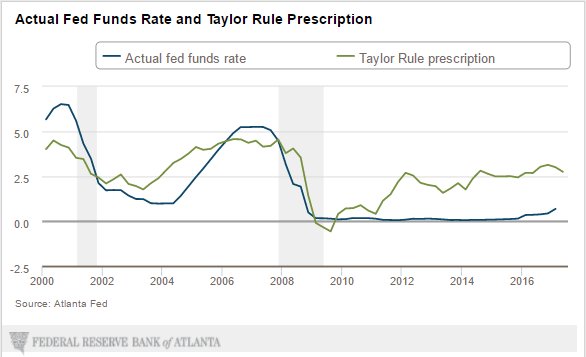
Here is what might is likely to spook the markets. Any Republican nominated to the Board of the Federal Reserve is likely to favor a rules based approach to monetary policy decisions. A fixed rule for determining interest rates, such as the Taylor Rule, is going to result in much higher interest rate than what the Fed Funds rate is today (see the Atlanta Fed’s Taylor Rule Utility).
Any new Republican Fed chair is therefore going to steer the Fed in a more hawkish direction. Even if Yellen and Fischer are not replaced, new Republican Fed governors on the Board are likely to favor a more aggressive monetary policy. As Janet Yellen’s term expires in February 2018, any decision to replace her will be announced in the fall.
The critical window will be in the fall, when the Trump administration is likely to announce its decision on the fate of the Fed chair and vice chair. The market could have a signal even earlier if a rules based advocate of monetary policy like John Taylor, who is known for the Taylor Rule, were to be nominated to one of the open seats on the Federal Reserve Board.
What now?
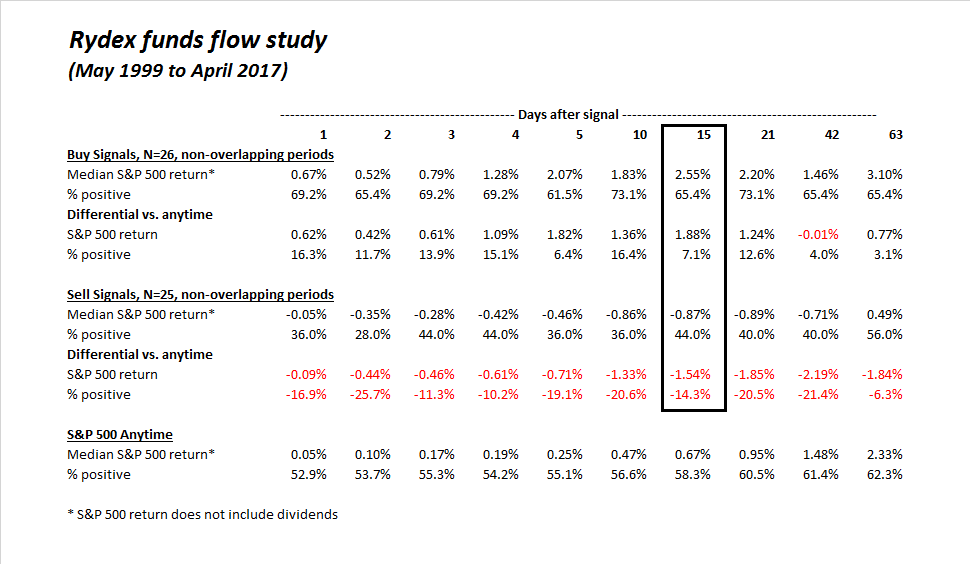
So far, what we have a “this will not end well” story with a number of bearish tripwires that have not been triggered. In the interim, market conditions are not very much changed from last week. The Rydex sentiment sell signal that I wrote about on Monday remains in force (see The right and wrong ways to use Rydex sentiment). Nine days after the sell signal, the SPX is +0.11%, which is ahead of historical experience.
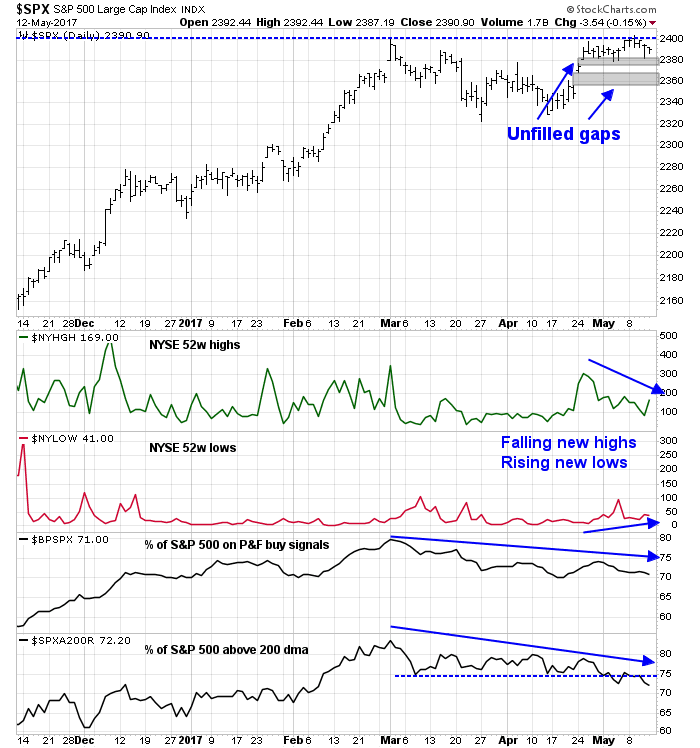
The SPX remains range bound between 2400 as resistance and 2380 as support, with a couple gaps that could be filled below should the market weaken. As well, the chart below shows that the market is experiencing a number of minor negative breadth divergences with bearish implications.
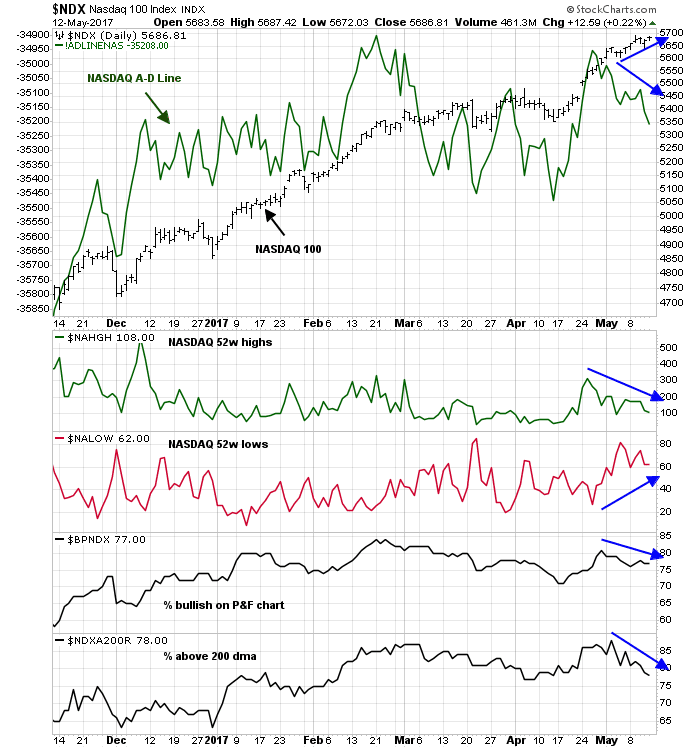
The NASDAQ 100, which is rallied to fresh highs, is also exhibiting similar levels of negative divergences.
Schaeffers Research highlighted a contrarian sell signal last week. Equity only put/call volume fell to levels indicating high levels of complacency. If history is any guide, near term returns are likely to be subpar.
Specifically, the all-exchange equity-only put/call volume ratio fell to 0.67 on Wednesday, marking the third straight reading below 0.80 — something we haven’t seen since mid-December, according to Schaeffer’s Quantitative Analyst Chris Prybal. Further, it was the lowest daily reading since Dec. 15, 2016. “The giddiness of options traders is becoming apparent,” he said, with the 10-day average of this ratio hitting 0.84, marking the lowest point since Feb. 22.

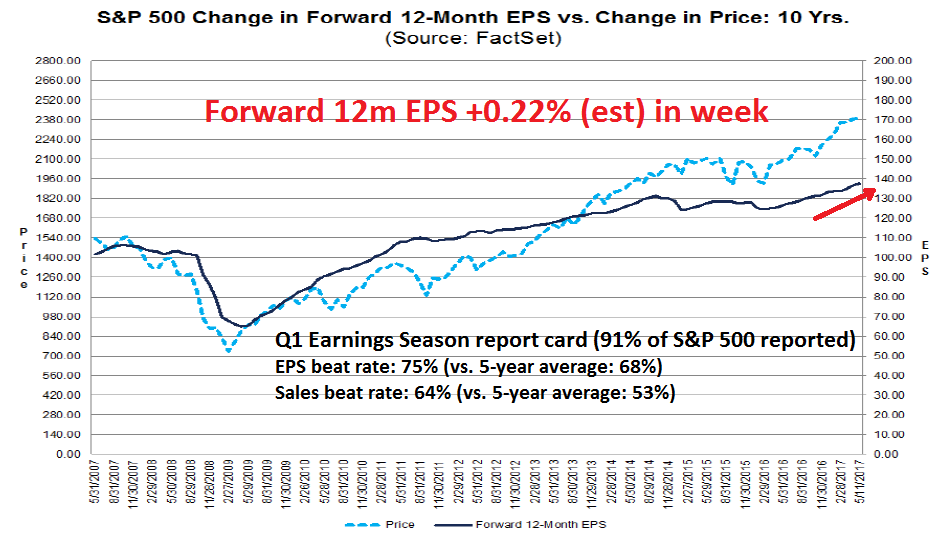
On the other hand, the latest update from FactSet shows that the report card from Q1 Earnings Season has been solid. Both EPS and sales beat rates are well above historical averages. Forward 12-month EPS estimates continue to rise. These growth expectations should provide a floor on stock prices should the market correct.
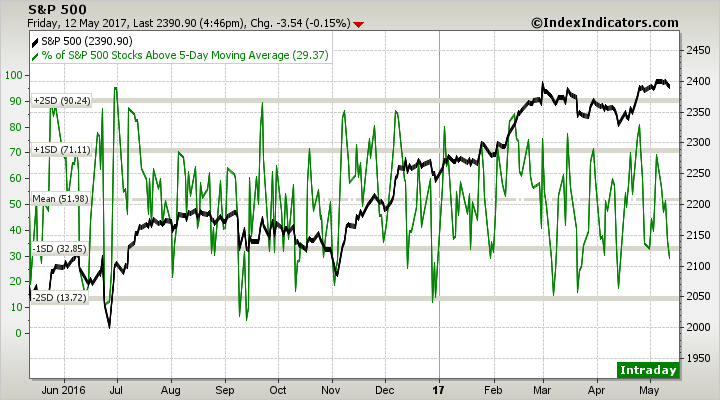
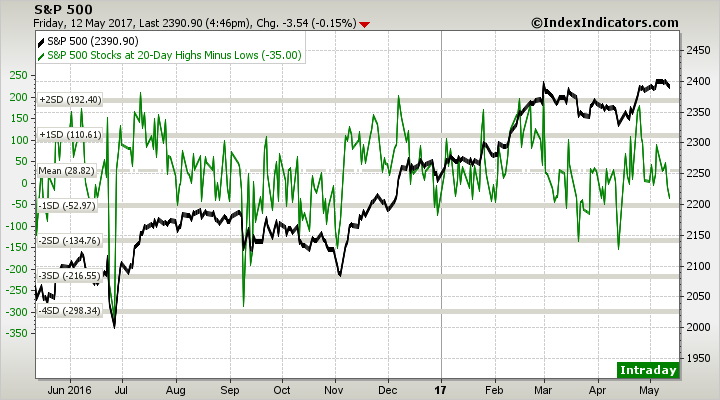
Short term breadth metrics are not overly revealing of market direction. This chart of stocks above their 5 dma from Index Indicators indicates that the market is mildly oversold, which could lead to a one or two day bounce early in the week.
On the other hand, longer term breadth indicators are in neutral with a negative momentum bias, indicating that the market has the potential to pull back further over the next week.
I wrote last week that the stock market may be suffering from a bout of round number-itis, where the market advance stalls out as key major averages rise to round numbers (DJIA: 21,000, SPX: 2,400). I expect that consolidation and mild pullback will continue for another week or two before the rally can continue.
My inner investor remains bullish on equities. In the absence of a bearish trigger that signals a high risk environment or impending recession, he will be constructive on equities.
My inner trader put on a small short position last week, but it was not a high conviction trade. He is hoping for signs of either a short term bearish sentiment extreme or oversold conditions as a signal to cover his positions.
Disclosure: Long SPXU, TZA
Cam,
Thanks for another excellent piece. Reading your weekly analyses of different factors that can effect my returns, keeps my stress level at low. Thanks for all your efforts which help me keep my sanity in the investment realm.
Moe
Previous bull markets died when the economy overheated and the Fed ramped up interest rates. There is no overheating in sight. Fears of a sharp upswing in interest rates are fading. Inflation is cooling not rising just as the Fed said it would. Junk bond spreads are staying low. The global economy is doing fine and a European political crisis has been averted with the French election and just this weekend Merkel’s party won a big German regional election. I smell roses.
If you are like me, I watch in horror at Trump’s antics and the great global investment fundamentals get lost from attention. I can’t unglue my eyes from news reports about him. They worry the hell out of me. If the markets are up because of Trumpenomics then we could be in trouble if he and the GOP stumble or blow up. That’s a crap shoot. But I see that the World Market ex-U.S. Index is outperforming America for the first time in years. If anything, America First should hurt those markets. Maybe markets are tracking positive global business conditions, a reassuring thought.
I see technology is a leader. It’s not a Trump favorite. It’s just a great business in the midst of a giant digital revolution.
Lately, I have traded somewhat out of sectors that rely on Trump’s blessing to technology, NASDAQ and Europe that don’t. It lessens my Trump worries.
I ask myself. how does the Comey fiasco actually affect consumer and business habits? It’s not like a super popular President now has poor ratings. That type of big swing might cause a ripple in consumer habits. But no, the ratings have gone from bad to more bad. Not a big swing. Not an impact on the economy.
This post is about me trying to minimize my Trump worry and smell the roses. It’s working a bit but I need a lot more therapy. Thanks for your ear.
Ken
Keep your Political Comments to yourself.
Right on Peter. I forgot a rule my mother use to have about not discussing religion or politics. I hear you.
To get a lilttle more specific on technology, the semicondutor index SOX has broken out to the upside again and regained that trendline after being outperformed by internet stocks (FDN) earlier in the year. One could argue that the leadership of internet stocks was a sign that investors were betting on slower economic growth and have changed their mind somewhat over the last few trading days.
At his core Trump is a real estate developer and, as such, likes low interest rates. Additionally, it seems the Republican crowd is losing influence in the WH so I see appointees to the Fed as being less hawkish than the consensus view. Anecdotally, seems Rick Santelli complains a lot less about the Fed’s easy money policy post Trump election. Expect Yellen to complete term and smooth transition to new Fed chair next year.