Mid-week market update: In the past two weeks, I have become progressively more bullish on stocks (see A capitulation bottom? and Buy signals everywhere), based on the belief that the risk/reward trade-off was tilted in favor of the bulls. Even as the market bottomed with sentiment at crowded short levels, the rebound had been unusually weak with little bullish follow-through. That pattern was broken this week when the stock market finally put together two consecutive up days.
In order for this rebound to turn into an uptrend, the market has to show some positive momentum, with a series of “good overbought” conditions. Such episode tend to be characterized by RSI-5 (top panel) getting overbought and staying overbought, as well as the SPX riding the top of the Bollinger Band (BB). The chart below shows some past examples of bullish impulses in the last two years.

Can the market continue upwards, or will it stall as it tests resistance at its all-time highs? Will the market focus on the bullish message of the Trump tax proposals, or news reports indicating that the Trump administration is giving notice that it is getting ready to withdraw from NAFTA? Here is what I am watching.
A possible bullish breadth thrust
There is some reason for bullish optimism as there are signs of a possible broadly based upside breadth and momentum thrust. Some encouraging signs come from the other major US indices as both the NASDAQ Composite and the Russell 2000 made new all-time highs this week. In addition, Chris Ciovacco pointed out that the market is experiencing a bullish breadth divergence, based on net NYSE new highs vs. lows.

Another constructive sign came in the form of a possible breadth thrust. I had written about the Zweig Breadth Thrust before (see A possible, but rare bull market indicator). Steven Achelis at Metastock explained the indicator this way:
A “Breadth Thrust” occurs when, during a 10-day period, the Breadth Thrust indicator rises from below 40% to above 61.5%. A “Thrust” indicates that the stock market has rapidly changed from an oversold condition to one of strength, but has not yet become overbought.
According to Dr. Zweig, there have only been fourteen Breadth Thrusts since 1945. The average gain following these fourteen Thrusts was 24.6% in an average time-frame of eleven months. Dr. Zweig also points out that most bull markets begin with a Breadth Thrust.
Currently, we don’t have the setup for a classic Zweig Breadth Thrust (ZBT). However, the ZBT calculation is based on NYSE breadth. As good traders are well aware, NYSE breadth statistics are distorted by the presence of a number of closed-end funds and REITs, which do not necessarily reflect market action of common stocks.
To remedy this problem, I developed a ZBT indicator based strictly on SP 500 breadth as an apples to apples comparison of market breadth. As the chart below shows, the SPX ZBT Indicator is nearing a buy signal, but not yet. It has until the market close on Friday to exceed the top line and signal a momentum thrust.
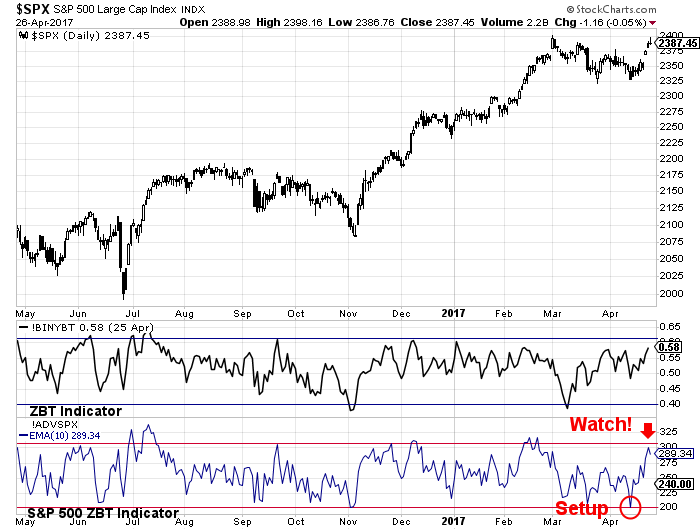
Readers who would like to follow along at home can use this link to get updates.
Look for confirmation
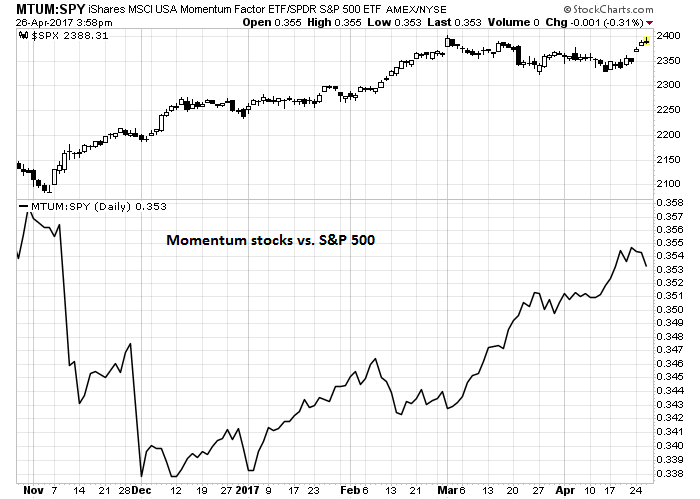
If a breadth thrust were to continue, then one of the secondary signs that I would be watching for as confirmation is the continued outperformance of the price momentum factor. The chart below depicts the relative return of momentum stocks against the market. A definitive rollover in this factor would be a warning sign that to turn more cautious.
For now, my inner trader is enjoying this bull run, but he is keeping an open mind as to whether it can continue.
Disclosure: Long SPXL, TQQQ
Cam, nice work! Marty Zweig said that the ZBT happened 14 times since 1945. Not very often. The last ZBT was in Nov 2016. Based on the average gains, that would put us to Oct 2017. I work with cycles and the long term cycles I watch suggest a high in 4Q 2017. So, in my opinion, I would think that the ZBT may not happen again in this month. But I do like what you did with the ZBT ! Keep up the good work!
Best
Founding Subscriber
Thanks for the analysis. Market was rejected at an all time high yesterday. Trump tax plan was a back of the napkin thumb nail sketch. The market was not impressed. Best outcome here would be a shallow sell off and resumption of the next leg higher, (may be wishful thinking). One good thing is the VIX index is printing an all time low, indirectly implying low probability of a big sell off (would be a contrarian long side buy).
Thanks for being awesome as always, Cam. Referring to BAML surveys, institutional investors’ underweight allocation towards US equities points to a more excitable market. Euro and EM equities on the other hand are too overowned. But US equities are more expensive and bond sentiments are also at a negative extreme. In conclusion: no comment.. at least from the cross asset sentiment side of things
Very good earnings from Googl and Amazon. Nasdaq futures are up strongly but S&P futures are not. Kind of puzzling. Would love to see S&P close this week above 2400.
Guys new subs here. Came across Cam’s work and very intrigued. Am posting a tweet by Chris who may have been quoted on the site previously. Seems there maybe a bear bias into June https://twitter.com/ChrisPrybal/status/851469376377237504 or do you think this could be the setup for the market to run.
Could be a hedge against large long position(s). Here is another way to hedge: building a May VIX futures contract around the 1230 level. This is a 35 year low. At a 35 year low, probability of the contract cracking higher may be much higher than probability of going lower (likely asymmetric risk here). Just my 2c.
Cam,
In the wake of what just happened to Home Capital Group, do you see the risk spreading to CDN banking stocks? I’m thinking of paring back what I own of the Big 5.
I have no special insights into the Canadian banks. FWIW, Marc Cohodes has been a prominent bear on HCG and the Canadian housing market. He indicated that he has no short position in the Big Five Canadian banks.