Mark Hulbert recently highlighted an equity buy signal from an obscure indicator, the gold/platinum ratio. The signal is based on a research paper by Darien Huang, an academic at Cornell.

The rationale behind the indicator goes something like this. Both gold and platinum are precious metals, which have defensive characteristics during equity bear markets. But platinum has more cyclical characteristics because of its use in the auto industry. A high gold/platinum ratio (as it is today) is indicative of fear in the market, and therefore stocks should be bought. Conversely, a low platinum/gold ratio signals complacency, which is a sell signal.
The way to approach cyclical indicators like these is to decide whether an investor should bet with them (momentum indicator), or against them when readings are extreme (contrarian indicator). The chart below shows the platinum/gold ratio (in red) and stock prices (in grey). The bottom panel shows the rolling one-year correlation between the ratio and stock prices.
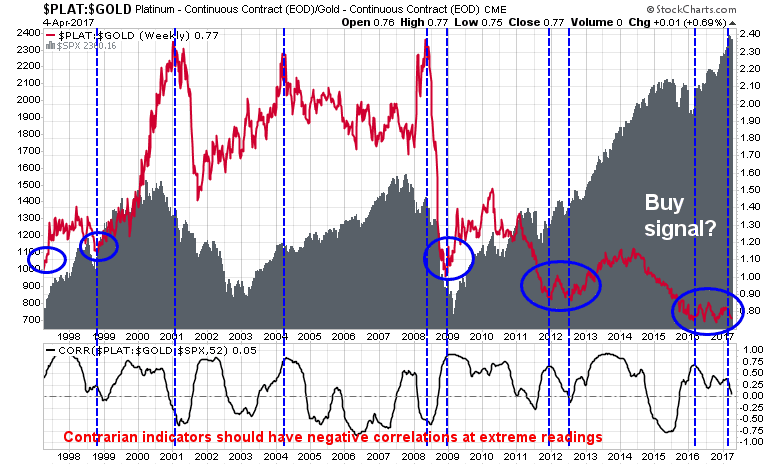
Based on this chart, I can make a couple of observations. At first glance, this seems to be a reasonably good contrarian indicator at extremes. But given the wide ranges, how can you tell what’s an extreme reading?
One way to determine whether a contrarian indicator works well at extremes is to look at the correlations of the signals to the market. A good contrarian indicator should see negative correlations to the market at the time of buy or sell signals, or soon after buy and sell signals. An analysis of the lower panel indicates that is not the case. In fact, rolling correlations appear too unstable for this ratio to be an effective market timing indicator.
Maybe we are framing the problem incorrectly. Instead of using the SPX to measure the effectiveness of this model, how about using the stock/bond ratio as a measure of risk appetite? The chart below shows the same indicator overlaid on top of the stock/bond ratio. The correlations shown on the bottom panel are better, but they are still very unstable, and correlations were not negative when or after buy and sell signals.

Back to the drawing board? Not quite. There are better ways to measure the real-time strength of the cycle.
Better cyclical indicators
Darien Huang’s work with the gold/platinum ratio is thematically similar to Charlie Bilello’s research using the lumber/gold ratio. Bilello used lumber to stand in for the cyclical component of his ratio, instead of platinum.
The history of lumber prices don’t go back 20 years, but the chart below shows the lumber/gold ratio against the stock/bond ratio, as a measure of risk appetite. The bottom panel shows that rolling one-year correlations were more stable. My conclusion is this ratio is more suitable as a momentum indicator rather than a contrarian indicator. The rolling 5-year average of lumber/gold to stock/gold is 0.47, which is pretty good.
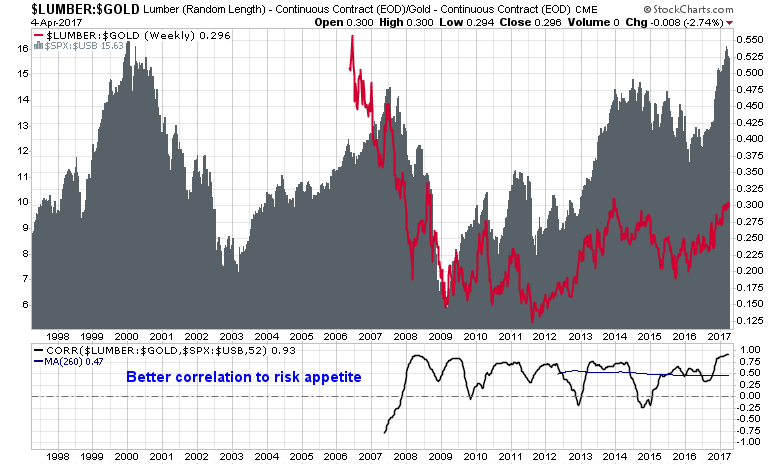
Currently, this ratio is supportive of a rising risk appetite as lumber prices, which is reflective of housing strength (and possibly the Trump wall with Mexico), are in a relative uptrend compared to gold.
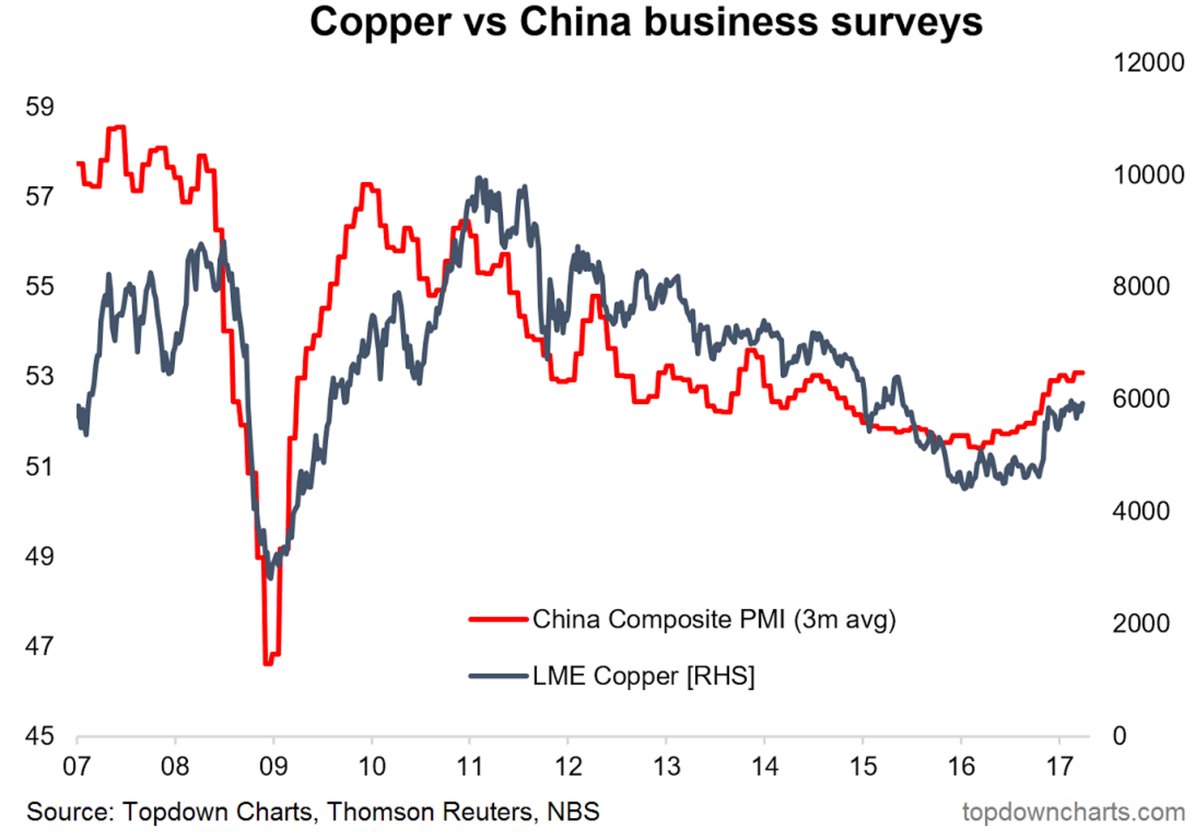
One of the disadvantages of using lumber prices as the cyclical component in a lumber/gold ratio is lumber prices are reflective of regional demand and does not measure the global cycle. For that, industrial metals is a better substitute. Callum Thomas pointed out that copper, which is one of the major industrial metals, is highly correlated to Chinese manufacturing momentum.
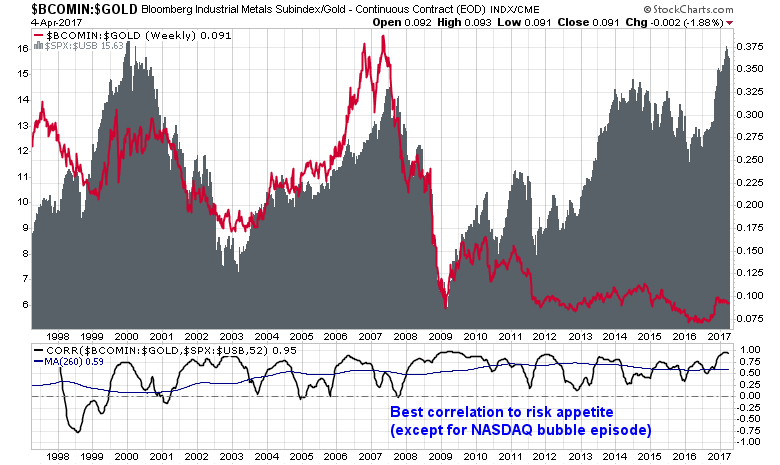
The chart below shows a similar analysis using the industrial metals/gold ratio as a cyclical indicator. The bottom panel shows a similar level of stability in correlation, with the rolling 5-year correlation at 0.59, which is higher than the lumber/gold to stock/bond correlation of 0.47.
What are they saying now?
If we are to reject the Huang model based on the gold/platinum ratio in favor of the lumber/gold and industrial metal/gold ratio, what are they saying now?
As the chart below of these ratios using daily prices shows, there is a bifurcation between these two indicators. The lumber/gold ratio is rising, which tells an upbeat story of US housing. By contrast, the industrial metal/gold ratio has been in a slow downtrend, which is reflective of lagging growth outside the US.
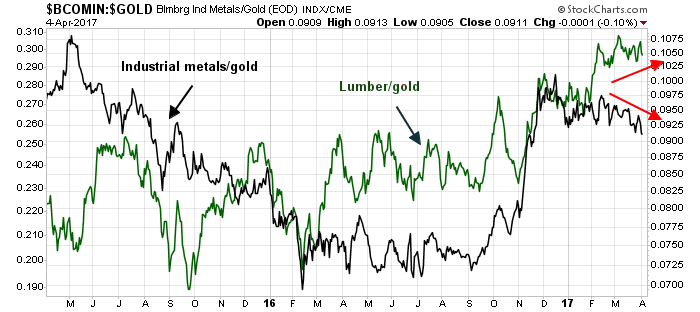
I interpret these readings cautiously, with continued cyclical strength in the US, but non-US growth (China in particular) needs to be watched carefully.
Emerging markets are being touted as cheap relative to US markets. Industrial metals to gold ratio shown above indicates a picture of malaise in EMs. Does it indicate the relatively cheap valuations in EMs are to be avoided or are they a good buying opportunity?
Cam, it appears that there is a broad upturn (following 5 or so years of continued weakness) in global pmi and commodities overall. I know China is the elephant in the room and in recent history is the main engine behind demand for commodities. also commodities are typically the very best hedge against inflation. so > in global inflation = > in commodities = > in emerging market equities in this cycle that began in 2016. Your thoughts?