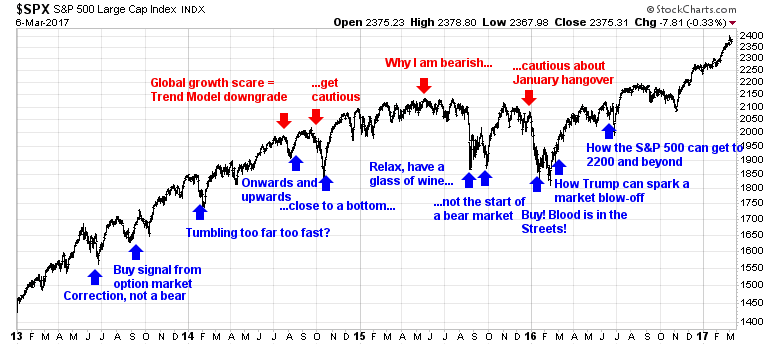
I have had a number of subscribers ask me to extend the chart of my longer term calls, which had only gone back two years. The chart below shows the highlights of my posts back to 2013, which are intended for investors with a 6-24 month time horizon. I haven’t been always right. On occasion, I was early, late, or simply mistaken.
Here are the links to the past posts shown in the above chart.
A correction, not a bear June 2013
A buy signal from the option market September 2013
Are stocks tumbling too far too fast? January 2014
Global growth scare = Trend Model downgrade July 2014
Onwards and upwards August 2014
3 reasons to get more cautious on stocks September 2014
Getting close to a bottom, but not yet October 2014
Why I am bearish (and what would change my mind) May 2015
Relax, have a glass of wine August 2015
Why this is not the start of a bear market September 2015
The reason why the bulls should be cautious about a January hangover December 2015
Buy! Blood is in the Streets January 2016
Super Tuesday special: How President Trump could spark a market blow-off March 2016
How the S+P 500 can get to 2200 and beyond June 2016
In addition, these are the buy and sell calls of the trading model, which are designed for traders with a 1-2 week time horizon. Again, I haven’t been always right. The most recent failure occurred when the trading model got caught long (and wrong) in the correction in late 2015.
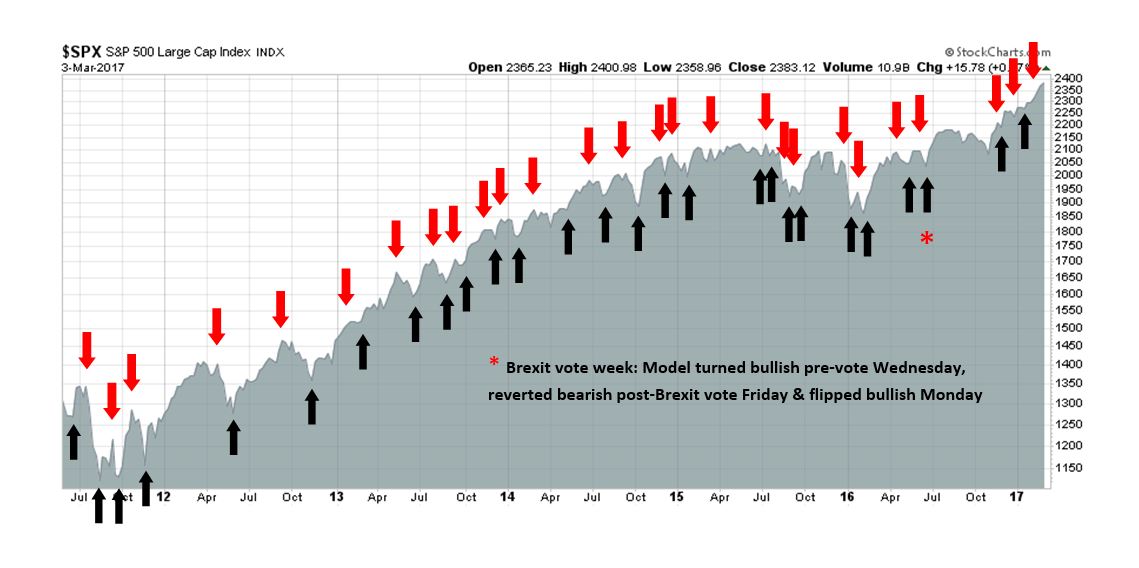
Judge for yourself.
Looks pretty damn good to me. Thanks – Cam.
Well done
If you are going to post a chart w trading signals, in the future please make it clear that the Trend Model has changed from neutral or bear to bullish. I’ve reviewed the articles above where you say you signaled a change but there is no mention of a change in the Trend Model. Going forward, I would hope you will be transparent in these market calls. The chart looks great and will entice subscribers but I need these signal changes plainly stated rather than a change in sentiment that in hind sight you put an up or down arrow on. Thanks for your consideration on this.
I’ll echo Alan’s comments. Just one example: the October 2014 call “Getting close to a bottom, but not yet”, shows as a buying signal on the chart above. But the post itself, while discussing the possibility of a possible bottom (in the market, everything is possible), was hardly bullish. I never act on the basis of analysts’ buy or sell signals and read your blog because I like how you think. But track records are important to validate an analyst’s judgment over the long haul, and transparency is essential. Removing ambiguous calls from your track record would still leave a remarkable performance and no one gets things right even 80% of the time. So, please continue posting your track record, but try to avoid cherry picking. Thanks for understanding.
Has there been a reply to this thread on Transparency? Have received nothing in my email. The updates and thinking are superb, but if Cam is going to post a chart w trades, then I think the signal calls should be clear, not a ‘well this might be a bottom….’