Preface: Explaining our market timing models
We maintain several market timing models, each with differing time horizons. The “Ultimate Market Timing Model” is a long-term market timing model based on the research outlined in our post, Building the ultimate market timing model. This model tends to generate only a handful of signals each decade.
The Trend Model is an asset allocation model which applies trend following principles based on the inputs of global stock and commodity price. This model has a shorter time horizon and tends to turn over about 4-6 times a year. In essence, it seeks to answer the question, “Is the trend in the global economy expansion (bullish) or contraction (bearish)?”
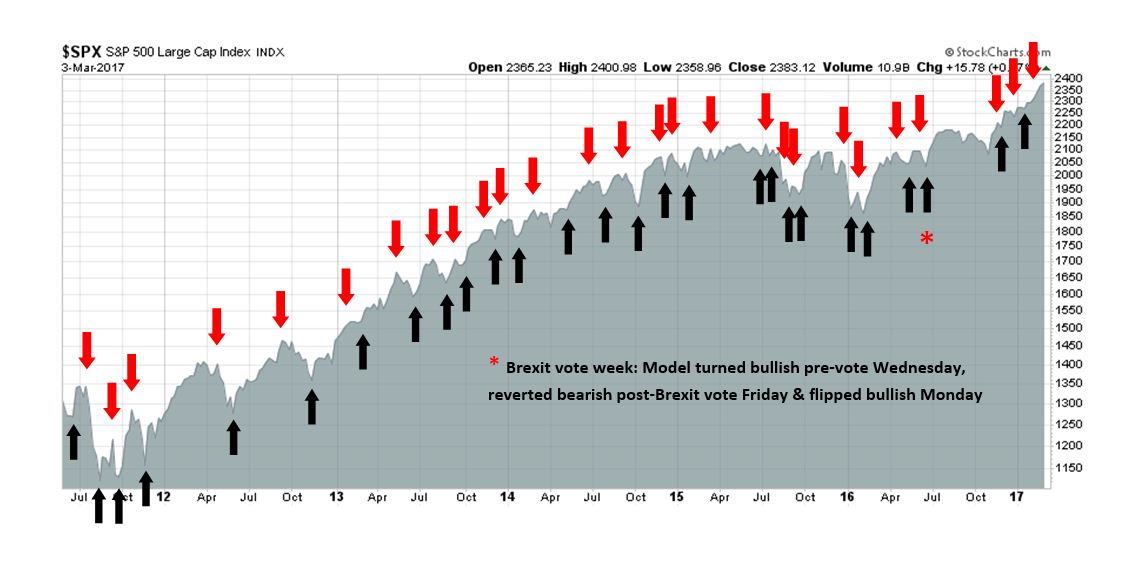
My inner trader uses the trading component of the Trend Model to look for changes in the direction of the main Trend Model signal. A bullish Trend Model signal that gets less bullish is a trading “sell” signal. Conversely, a bearish Trend Model signal that gets less bearish is a trading “buy” signal. The history of actual out-of-sample (not backtested) signals of the trading model are shown by the arrows in the chart below. Past trading of the trading model has shown turnover rates of about 200% per month.
The latest signals of each model are as follows:
- Ultimate market timing model: Buy equities
- Trend Model signal: Risk-on
- Trading model: Bearish
Update schedule: I generally update model readings on my site on weekends and tweet mid-week observations at @humblestudent. Subscribers will also receive email notices of any changes in my trading portfolio.
An over-valued and frothy market
As the major market indices hit new all time highs, I have become increasingly cautious on the short-term outlook. I view the stock market through the following lenses, and all of them are showing either a neutral to bearish outlook:
- Valuation
- Interest rates outlook
- Growth
- Psychology
The one wildcard continues to be political developments from Washington. A recent AAII survey indicated that roughly 75% of respondents cited politics as affecting their investment decisions:
This week’s Sentiment Survey special question asked AAII members what factors are most influencing their six-month outlook for stocks. Nearly three-quarters of respondents (73%) cited national politics, particularly President Donald Trump’s polices and what actions Congress may take. Tax reform was mentioned by many (20% of respondents), followed by regulatory reform and uncertainty over what legislation will actually be passed. Just under 23% of all respondents listed the ongoing rally and the prevailing stock valuations, with several of these respondents expressing concerns about the level of valuations or that a drop could be forthcoming. Monetary policy was cited by 8% of all respondents, followed by corporate earnings growth (7%) and investor sentiment (7%). Some respondents listed more than one factor.
Any changes in the path of fiscal or trade policy have the potential to create further market volatility.
An expensive market
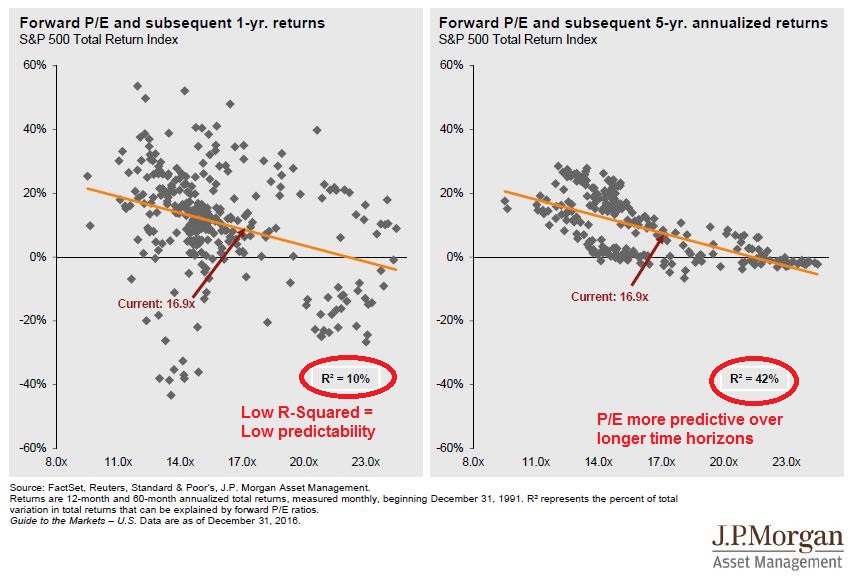
There are many ways of measuring market valuation. A number of different approaches are all pointing to an expensive market. I would warn, however, valuation is a poor short-term market timing indicator. As this chart from JPM Asset Management shows, while forward P/E has an inverse relationship with subsequent returns, the R-squared of the relationship with a one-year return is a low 10%, indicating that P/E explains 10% of actual returns. By contrast, the R-squared of forward P/E against five-year return is a much higher 42%.
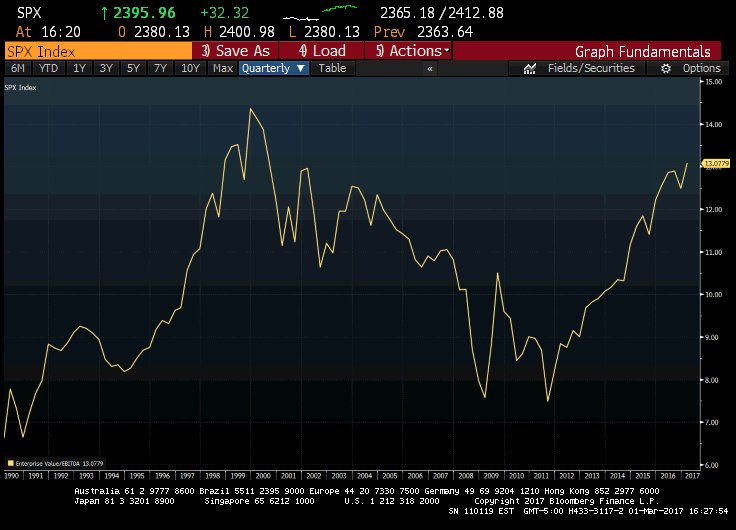
Nevertheless, plenty of valuation metrics are flashing warning signs. The SPX EV to EBITDA ratio, is at nosebleed levels that are comparable to Tech Bubble era.
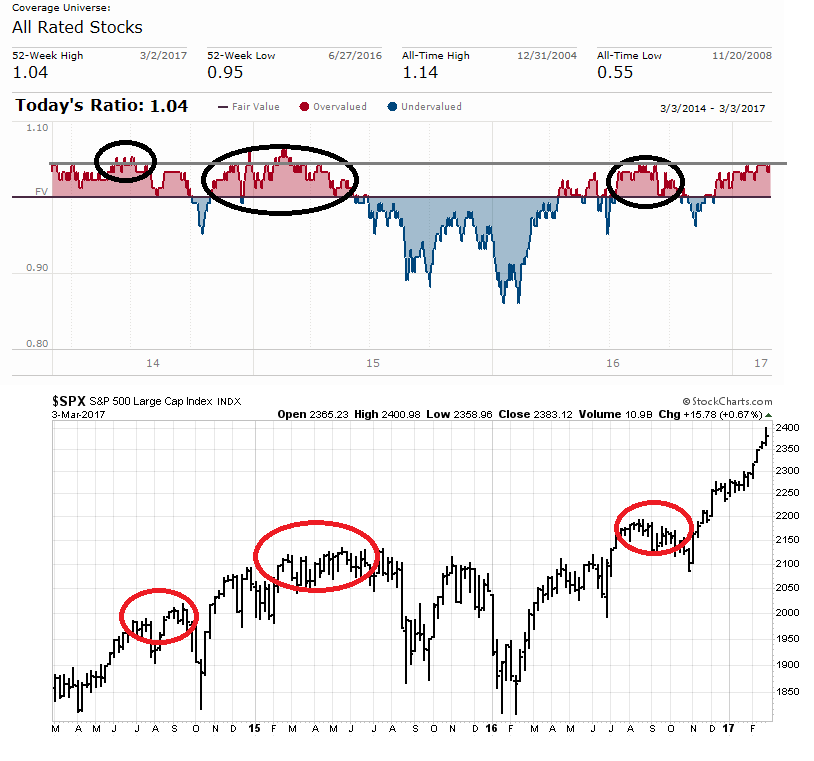
A more sophisticated valuation model is the Morningstar Fair Value Estimate, which shows the market to be about 4% overvalued. In the past, the stock market has experienced difficulty advancing when readings get this high.
Another indirect way of discerning whether the market is over or under valued is through the behavior of corporate insiders. This group of “smart investors” are not day or swing traders. They invest with longer time horizons because they prefer to take advantage of the lower tax treatment of long-term capital gains on sales. As the chart from Barron’s below shows, readings are volatile but the pattern of prolonged selling is evident. When insider selling coincides with overvaluation as measured by the Morningstar Fair Value Estimate, the warning signs are clear.

In addition, the cautious forecast made by the analyst Mark Hulbert characterized as one of the respected market forecasters made me sit up and take notice. Former Value Line research director Sam Eisenstadt set a six month target of 2230 last December. The chart below depicts Eisenstadt’s multi-track record that show his six month forecasts and actual subsequent SPX level.

Back in December, Eisenstadt had a six month SPX target of 2230, which is well below the current level of the index. The chart below depicts his recent track record going back to 2013. During that period, his model have tended to be overly bullish and in only one case did the actual index level overshoot his forecast.

Hulbert wrote that rising interest rates was the principal reason for Eisenstadt’s cautious outlook:
What are the factors driving Eisenstadt’s current forecast? In an interview, he said that the largest factor by far is the recent increase in interest rates. He added that he finds it surprising that most investors don’t seem to be paying attention or to care about this increase, given how obsessed they were not that long ago with the interest rate outlook.
The Fed has spoken
Speaking of interest rates, I wrote in my last post (see A frothy, over-extended market): “When a dove like Brainard sounds this hawkish, there is little doubt about whether the Fed will raise rates at its March meeting.”
In a speech last Friday, Fed chair Janet Yellen signaled a rate hike at the upcoming March meeting is more or less baked-in:
In short, we currently judge that it will be appropriate to gradually increase the federal funds rate if the economic data continue to come in about as we expect. Indeed, at our meeting later this month, the Committee will evaluate whether employment and inflation are continuing to evolve in line with our expectations, in which case a further adjustment of the federal funds rate would likely be appropriate.
Stock prices are driven by two main fundamental factors, the E in the P/E ratio, and the level of the P/E ratio. If we invert the P/E ratio to an E/P, we get an earnings yield, which can then be compared to the risk-free rate. If the Fed raises the risk-free rate, then it puts downward pressure on P/E multiples.
An uncertain growth outlook
During the initial stages of a Fed rate hike cycle, bearish P/E compression from rising rates are often offset by a rising growth forecasts (see Scott Grannis: Rising rates are still bullish for equities).
However, the market is now hearing different forecasts of growth from the stock and bond markets. As the chart below shows, both stocks rose and the yield curve steepened since the election, which reflect better growth expectations. But these two indicators began to diverge in early February. Stock prices continued to rise, while the yield curve began to flatten, indicating that bond market expectations of slowing economic growth. To further add to the confusion, the 2/10s steepened a bit last week in response to the Fed’s rate hike message, while the 5/30s flattened. What’s going on?
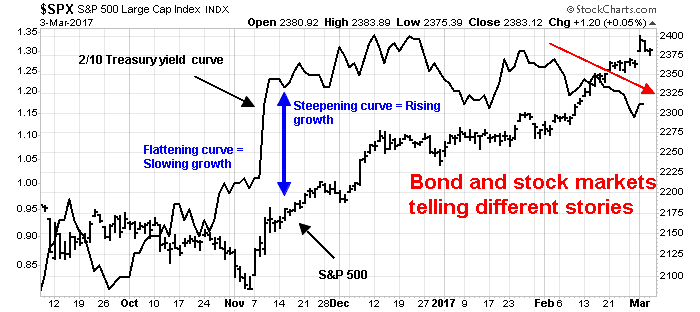
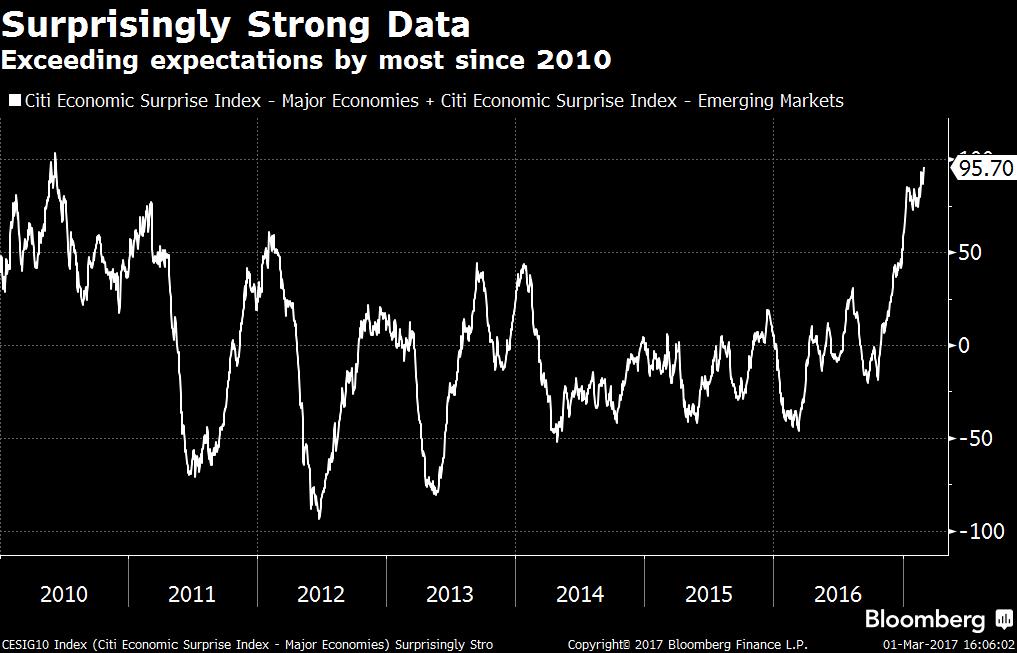
One explanation for the bifurcation is the stock market is focused on earnings, while the bond market is focused on economic growth and inflation. While the two growth outlooks are correlated, they are very different animals. As the chart below shows, the recent advance in equities has been global in scope, and it has been correlated with positive macro surprises, which suggests a cyclical element to the stock market rally (chart via Jeroen Blokland).

This analysis begs an important question. As Luke Kawa pointed out, the Global Economic Surprise Index (ESI) has hit the highest level since the world emerged from the Lehman Crisis. How much upside is left? By implication, what happens to equities should ESI start to roll over?
Another clue about the difference between the bond and equity growth outlook comes from Sam Eisenstadt’s SPX forecast of 2230 (see above). Remember, equity investors focus on earnings. When Eisenstadt developed that forecast in December, his model likely did not incorporate the effects of Trump’s proposal of corporate tax cuts and offshore cash repatriation incentives. Past top-down Street estimates of these fiscal effects add about 10% to SPX earnings (see How Trumponomics could push the SP 500 to 2500+). We can surmise that current market levels are discounting the positive effects of the Trump tax cuts. How long the market will remain patient with lack of detail from Trump fiscal policy therefore becomes an open question.
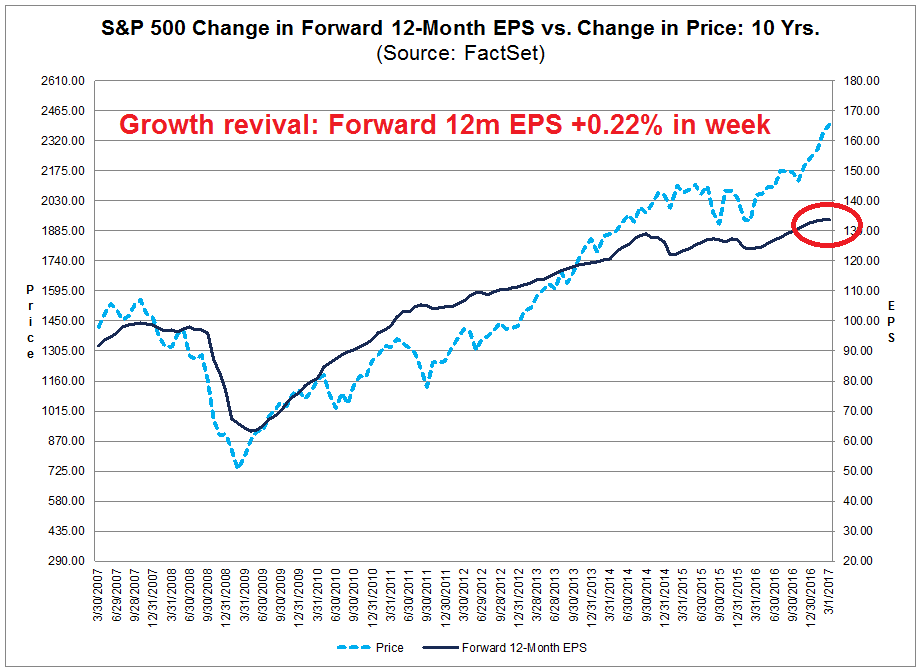
One positive development came from Factset. After several weeks of wobble, forward 12-month EPS have started to rise again, which is bullish for the earnings growth outlook. Should forward EPS continue to rise, continued growth should put a floor on any equity price correction.
Despite this positive development, growth bulls may not be totally out of the woods yet. New Deal democrat pens a regular weekly column where he analyzes high frequency economic data by splitting them into coincident, short leading, and long leading indicators. His latest analysis shows that short leading indicators are robust and pointing up, which reflects the strong performance by ESI and the revival in forward EPS estimates. However, his set of long leading indicators are starting to wobble as they weaken into neutral territory. While he is not ready to call a recession yet, Fed action may push more leading indicators into the danger zone.
Another interpretation of the bifurcation between bond and equity markets is a difference in time horizons. The bond market is focused more on the weakness in NDD’s leading indicators, while the equity market is focused on the upbeat short leading indices.
The Trump effect on growth
To be sure, the effects of Trump’s fiscal and trade policies are the wildcards for this market. Ed Yardeni nailed it when he outlined two main scenarios for the economy:
There are two alternative economic scenarios that follow from the above discussion. The economy continues to grow in both, though running hotter in one than the other. Of course, there is a third scenario in which the economy falls into a recession. That’s possible if Trump’s protectionist leanings trump his pro-growth agenda. However, I believe that Trump is intent on maintaining free trade, but on a more bilateral basis than a multilateral basis. So here are the two growth scenarios in brief:
Very hot. If Trump delivers a guns-and-butter fiscal program—including most of the tax cuts he has promised along with more defense spending and public/private-financed infrastructure spending—economic growth could accelerate. But so might inflation, given that the economy is at full employment. Government deficits would probably remain large or widen, causing public debt to increase. In this scenario, the Fed would be emboldened to increase interest rates in a more normal fashion rather than gradually. Bond yields would rise. This should be a bullish scenario, on balance, if the boost to earnings from lower corporate tax rates and regulatory costs is as big as promised.
Not so hot. Alternatively, if Buffett is right, and interest rates stay at current low levels, that would imply that Trump’s grand plans for the economy won’t be so grand after all in their implementation. Animal spirits would evaporate. Interest rates would stay low, but valuations would be hard to justify if earnings don’t get the boost that was widely discounted after Election Day.
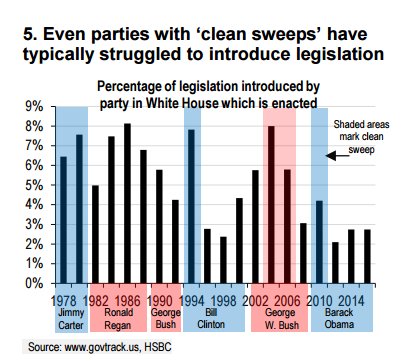
My base case is Yardeni’s “not so hot” outcome, which is mainly driven by legislative paralysis. While the equity market starts to discount the effects of lower tax rates, it may be disappointed. History shows that parties that have taken the White House and both chambers of Congress have struggled with their legislative agenda.
The Trump administration is unlikely to be different in that respect. Consider the accounts of the House Republican approach to the repeal and replacement of ACA, otherwise known as Obamacare. The GOP House leadership has unveiled a secret bill which only selected legislators and staff are allowed to read, and only in a secure room. Democrats and Republican senators need not apply (via Bloomberg).
Similarly, the tax reform proposals are getting bogged down in the White House and Congress. The Washington Post reported that the Trump administration is split on the issue of a Border Adjustment Tax, with Bannon, Miller, and Navarro in favor, and Mnuchin and Cohn against. CNBC reported that there is widespread opposition to a BAT within the Republican Senate. Any attempt to pass a tax reform bill with a BAT component will die on the Senate floor. Even if it were to pass, Nouriel Roubini pointed out that the imposition of BAT is likely to push up inflation by 1% or more, which invites a Fed response to raise interest rates at a even faster pace.
Conceivably, the Trump White House could try to pass a tax cut bill without BAT, which would explode the fiscal deficit. It is unclear whether such legislation could get passed over the objections of GOP deficit hawks. This “guns and butter” approach is highly inflationary and it would initially create a market blow-off. But the Federal Reserve would be forced to respond with surging interest rates to offset the inflationary effects of the fiscal expansion.
A frothy market
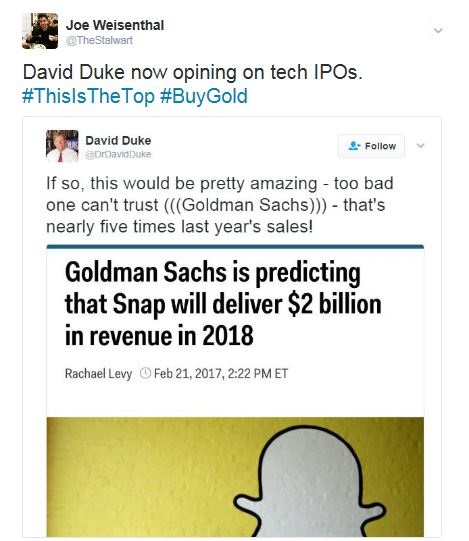
Another emerging sign of caution for equity investors are signs of froth, or excess enthusiasm. Some of the anecdotal evidence are reminiscent of the dot-com bubble era. As an example, when you have KKK leader David Duke tweeting about Technology IPOs, the market is much closer to a top than the bottom.
And why is Mike Tyson promoting trading platforms? Is he the modern version of the Pets.com sock puppet?

Moreover, Rydex investors have gone all-in on the bull side. The past two episodes has seen stock prices pull back. So far, the Rydex crowd has been correct in its positioning, but for how long?

Bloomberg also reported that Goldman Sachs found that investors are abandoning downside hedges in the most recent run-up:
Data from Goldman Sachs Group Inc. show investors have discarded hedges bought in the first leg of the global rally — between the November election and the end of last year — as they rush headlong into risk.
“Our indicator is now in-line with its most complacent level in the past six years, suggesting investors are generally unhedged across both equities and credit,” derivatives strategists at Goldman, led by John Marshall, wrote in a note on Friday.
Marshall and his colleagues calculate that investors are paying a low premium for the most liquid options across equity and credit, which offer a haven for investors during times of stress. So pronounced is the apathy over prospects for a broad market selloff that protective options have become too cheap to pass up, the analysts say.
Jesse Felder highlighted an equally disturbing development (via Marketwatch). Normally, the VIX Index and stock prices move in inverse directions. However, they have become correlated lately, which spells trouble for stock prices.

My own historical study of these episodes is shown in the table below. If history is any guide, the market is poised for a correction.

When I put it all together, the likelihood of a market correction is high. However, downside risk is mitigated by the upbeat growth outlook. Rising economic and forward earnings growth should act to put a floor on stock prices.
The week ahead
My base case scenario calls for risk appetite to weaken, based on the combination of legislative disappointment and rising interest rates. The downside risk on any correction is unlikely to be worse than 5-10%.
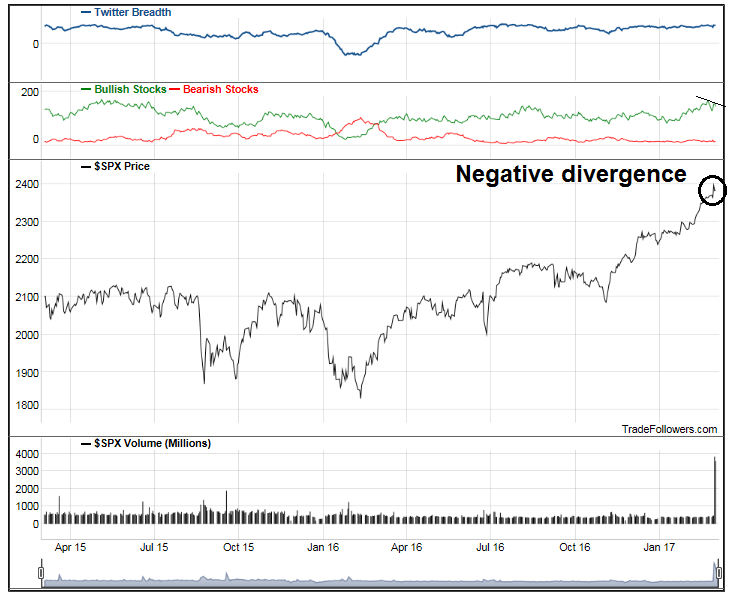
In all likelihood, a correction is likely to start at any time. Technical conditions are deteriorating. For example, Twitter breadth as measured by Trade Followers is exhibiting a negative divergence, as bullish breadth failed to confirm the new high.
My inner investor remains bullishly positioned as he is not overly concerned about minor pullbacks. My inner trader has entered into a small SPX short position. and he is waiting for a confirmed technical break before adding to his position.
Disclosure: Long SPXU
I use two portfolio strategies with my client portfolios, tactical asset allocation for determining how much to have in equities (using similar indicators as Cam mentioned above) and then a personally improved momentum strategy to choose which equities and fixed income to own.
This week, for the first time in a very long time, I shifted from a maximum overweighting in stocks to a normal weighting. The final straw was the likelihood of a Fed rate hike which just a short time ago only had a 20% probability. So it’s coming sooner than expected. Take a look at the chart.
https://product.datastream.com/dscharting/gateway.aspx?guid=1a1362e2-8a6d-4541-918a-2be4b9280d63&action=REFRESH
Another factor was the surge in investor sentiment after Trump’s congressional address. That sent sentiment indicators from optimistic to bubbly, a much riskier level.
I make these moves very seldom and won’t reverse it unless there is a significant change.
Why didn’t I go all the way to underweight? Because it seems to me to be too early in this new Trump bull market. I’m a big believer that one should err on the side of owning equities unless the environment gets VERY risky. And I will reduce to underweight or even much further. My client portfolios went UP in 2008 when the markets fell 50% because I became VERY risk averse.
Let me say something on the flattening of the 5-30 yield curve. Most investors don’t realize that QE is not dead in the U.S.. The Fed reinvests the huge amount of interest earned on their QE bond and mortgage purchases. They tilt towards buying 30 year mortgages and this in turn leads to downward pressure on long term Treasury interest rates.
James Bullard, the outspoken and very independent thinking President of the St.Louis Federal Reserve District, is starting the movement to have the Fed start unwinding its QE bond holding gradually sooner than later. Since he mentioned it, I’ve seen other Fed spokespersons and well known observers say this as well. Yellen in her March post-meeting address could mention it or the future minutes of the March meeting could see some talk of this.
This is a HUGE deal for fixed income markets. Nobody knows how the hell the Fed’s QE trillions of bond holdings will be unwound without causing a run up in bond yields. If they wait to sell bonds when interest rates are rising due to inflation or Trump budget deficits, the added upward pressure on rates could throw the U.S. into recession. The U.S. dollar would surge, hurting the economy. The housing industry would have the rug pulled from under it since mortgage rates are a function of 30 year Treasury yields. Auto loans are already seeing a big rise in delinquencies. Fed unwinding their balance sheet is the elephant in the room nobody wants to talk about.
If market players start seeing this Fed unwinding on the horizon putting upward pressure on long rates, I expect to see the 5-30 yield curve steepen big time as they sell their holdings to protect against losses preemptively.
Ken,
Your client portfolios went up in 2008? Are you taking on new clients? Hahaha. Not really kidding. I’m with a buy-and-hold-only advisor who refutes all the ideas presented here and some other pretty reasonable ones I wanted to do like convert some Canadian cash to US dollars when they were at par. It’s pretty frustrating.
Ken – Didn’t your clients give you a hard time about their capital gains liability in 2008?
Very funny!