Preface: Explaining our market timing models
We maintain several market timing models, each with differing time horizons. The “Ultimate Market Timing Model” is a long-term market timing model based on the research outlined in our post, Building the ultimate market timing model. This model tends to generate only a handful of signals each decade.
The Trend Model is an asset allocation model which applies trend following principles based on the inputs of global stock and commodity price. This model has a shorter time horizon and tends to turn over about 4-6 times a year. In essence, it seeks to answer the question, “Is the trend in the global economy expansion (bullish) or contraction (bearish)?”
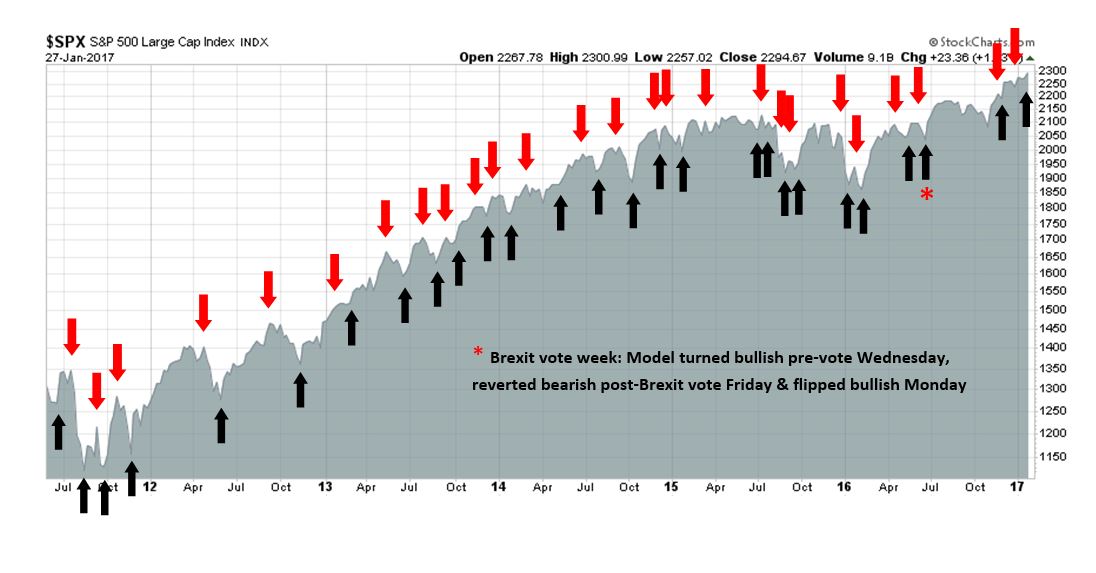
My inner trader uses the trading component of the Trend Model to look for changes in direction of the main Trend Model signal. A bullish Trend Model signal that gets less bullish is a trading “sell” signal. Conversely, a bearish Trend Model signal that gets less bearish is a trading “buy” signal. The history of actual out-of-sample (not backtested) signals of the trading model are shown by the arrows in the chart below. Past trading of the trading model has shown turnover rates of about 200% per month.
The latest signals of each model are as follows:
- Ultimate market timing model: Buy equities
- Trend Model signal: Risk-on
- Trading model: Bullish (upgrade)
Update schedule: I generally update model readings on my site on weekends and tweet mid-week observations at @humblestudent. Subscribers will also receive email notices of any changes in my trading portfolio.
It’s not all about Trump
In the past few weeks, market analysis in these pages have been all Trump, all the time. As America`s 45th president assumed his first full week in office, his administration made a number of rookie mistakes that gave the impression of a government in disarray.
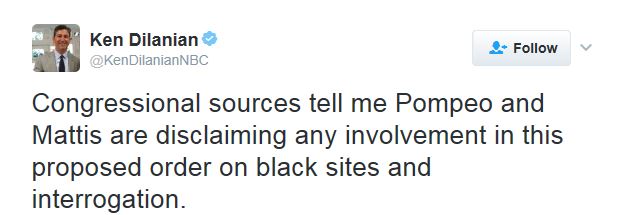
Politico reported that many of presidential executive orders were drafted by Trump aides Stephen Miller and Steve Bannon without consultation with the relevant departments or Congress. These actions made the implementation of some aspects of the executive orders difficult, impractical, or possibly illegal. CNBC reported that the Trump aides were leaking stories as a sign of infighting between different factions. Not only that, the Washington Post reported that most of the senior bureaucrats at the State Department, most of whom had served both Democrat and Republican administrations, had resigned en masse, which deprived the department of years of experience in the nuts-and-bolts of foreign policy.
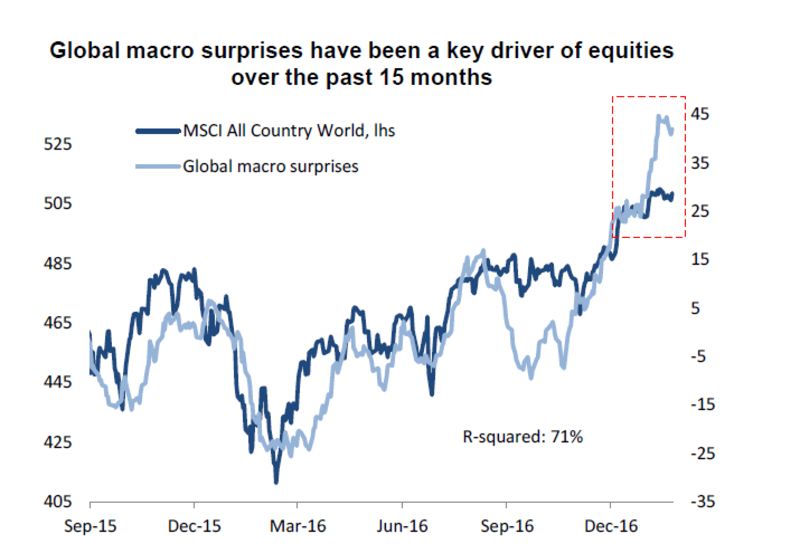
So how did the stock market react to these events? The Dow proceeded to rally above 20,000 to make an all-time high, as did the SPX. This kind of market reaction in the face of negative political news is bullish. Moreover, it showed that investors and traders had turned their focus to the most important metric of equity performance, namely the growth outlook.
Indeed, analysis from Deutsche Bank showed that macro growth surprises have been the biggest driver of equity prices for the last 15 months (via Bloomberg).
The reflation trade continues
It’s earnings season, and the market is turning its focus to the earnings growth outlook. I had an inkling that Q4 earnings season was going to come in reasonably well when Thomson-Reuters observed that there were an unusually low number of negative Q4 pre-announcements:
The more positive outlook by analysts is also supported by Q4 guidance with a negative to positive ratio of 2.0, which is more positive than the long-term (since 1995) historical average of 2.7.
The latest update from John Butters of Factset shows that, with 34% of the SP 500 having reported, the earnings and sales beat rates were roughly in line with their 5-year historical averages. Despite these slightly below par beat rate readings , they improved substantially from last week’s reports. More importantly for future stock performance, the Q1 guidance rate has been upbeat when compared to its history, and forward 12-month EPS continued to rise.

Other cyclical indicators, such as the Chemical Activity Barometer that is a leading indicator of industrial production, were showing signs of strength (via Calculated Risk).

Even the Q4 GDP report turned out to be a solid result despite missing Street expectations. Much of the shortfall could be attributed to the rising USD during that period.

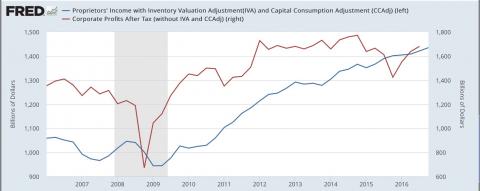
New Deal democrat was particularly impressed with the trend in proprietors’ income (blue line), which is a more timely proxy for corporate profits (red line):
This tells us that domestic US businesses with little exposure to foreign exchange issues continue to improve their top lines. Now that the strong 2015 US$ has disspiated, he likelihood is that corporate profits will follow. Needless to say, this is a positive for the next 12 months.
I wrote last week that I was seeing signs of a global reflationary rebound from equity and commodity prices (see Global market rally = Dow 20K). Jurrien Timmer at Fidelity Investments also saw a similar trend of a synchronized global recovery.

Is it any wonder the markets adopted a risk-on stance? The New York Fed found that there was a dramatic turnaround in Republican voters as to their outlook for the economy and stock prices. The chart below shows the net change in expectations that stock prices would be higher after the election, sorted by political leaning. While the Republicans show much greater optimism, expectations from Democrats are lower but still positive.

This evidence of the reawakening of “animal spirits” raises the odds of a market melt-up in 2017 (see my post last week Could “animal spirits” spark a market blow-off?). This chart from Jeffrey Kleintop at Charles Schwab shows that individual investors have shown a habit of chasing returns. As equity returns start to improve, watch for the equity stampede to begin.

Breakout or fake out?
Still, I have this nagging feeling that we may be seeing a false upside breakout and what we are seeing is a bull trap. Jeff Hirsch of Almanac Trader found that stock prices tend to make a short term peak in early February in the first year of a new presidential term, followed by a correction into March. This seasonal analysis suggests that the market high window will occur some time next week.

This chart from Dwaine van Vuuren of Recession Alert (via Jeff Miller) shows that the readings of weekly leading indicators are at extreme level. Could these signs of macro improvements be as good as they get?

The same could be said of the Citigroup US Economic Surprise Index, which measures whether economic releases are beating or missing expectations (annotations are mine).

In addition, the wildly bullish tone of Barron’s front page and lead story flashed a contrarian sell signal.

As well, the latest update of insider activity from Barron’s shows that this group of informed investors were not showing confidence in the market. To be sure, the last episode of high insider selling resolved itself in a sideways market with little upside.
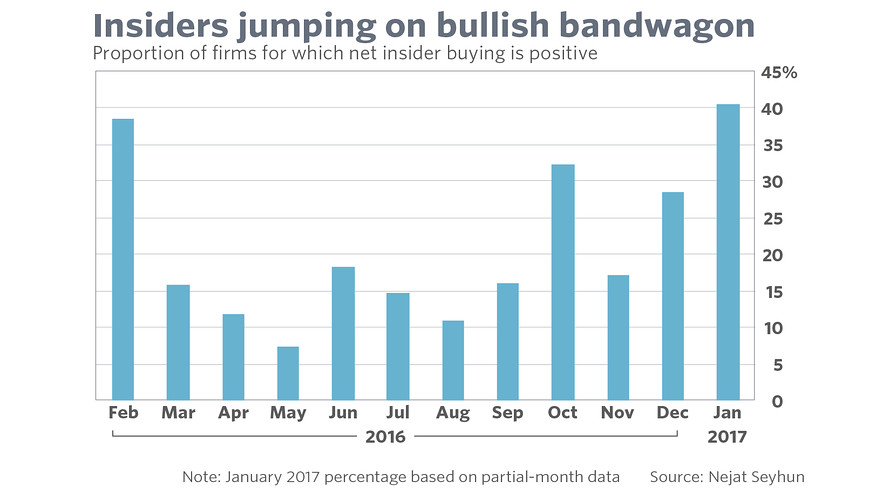
By contrast, Mark Hulbert highlighted an insider study by Nejat Seyhun, which eliminates trading activity by large holders of stock, that came to a bullish conclusion.
What are to make of these conflicting conditions? Are we seeing an honest to goodness upside breakout that will take stock prices to further new highs, or is this a fake out, which will be followed by a February correction? I have no idea. Sometimes you are faced with two contrary scenarios, they defy analysis, and you have to be open to all outcomes.

Who knows, maybe mommy really is a superhero.
The week ahead
Here are some of the signs that I am monitoring in the week ahead. Market internals of risk appetite are holding up well so far. Any breaches of these relative uptrends would be a signal of the start of a correction.

The behavior of high yield, or junk, bonds is also confirming the narrative of a rising risk appetite. Similarly, I am watching for negative divergences, which have not occurred so far.
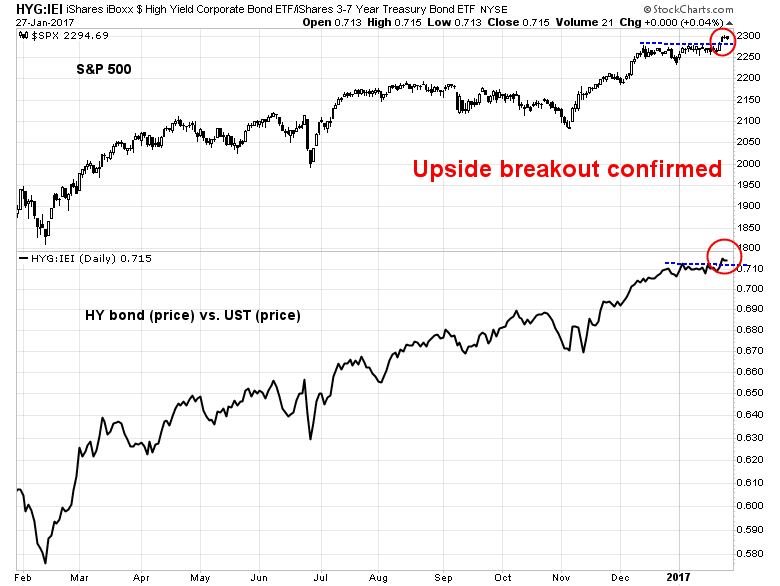
The SPX broke out to new highs early last week and the index has consolidated sideways. It would be no surprise to see it pull back to test the breakout level at 2280. Should stock prices race ahead and melt up, I am watching if the VIX Index (bottom panel) breaks down through its lower Bollinger Band. Such episodes have typically marked overbought conditions and short-term tops.

I am also monitoring the copper/gold ratio for signs of faltering macro momentum. This ratio is important as copper has both cyclical and hard asset characteristics, compared to gold, which is mostly a hard asset play. Should this ratio roll over, then it will be a real-time signal of faltering macro growth momentum.

My inner investor remains bullishly positioned. My inner trader covered his short SPX position last week and nervously went long the market.
Disclosure: Long SPXL
While the monthly CFNAI (Chicago Fed National Activity Index) data ticked upwards in December, as did the 3 month average the gains were, at best, tepid. Indeed, the 3 month average data has been below trend for a full two years beginning with the Feb 2015 data. Looking back as far as 2000 that mimics the dual recession periods of 200/2001 and 2008/2009. It is not incorrect to term the past two years an invisible recession.
The employment, unemployment and hours index has been in a decline for the past two years even as total employment continues to increase. However, the rate of change in total employment has also declined over the 2015/2016 period confirming the slow pace of economic growth.
Personal consumption and housing have increased slightly but can just as easily be said to be in a consolidation period. Housing permits have also been in a consolidation neither increasing nor decreasing – on average – over this period.
Production and income have generally been below trend as have sales, orders and inventories. A small exception is the 4th quarter of 2016 which was a very modest but noticeable above trend period.
All along the financial conditions index shows a consistent “accommodative” state which should have given support to improved economic growth but which clearly has been insufficient.
As with the other indexes consumer sentiment, hitting a relative high at the start of 2015 never really managed to improve over the past two years. At least until Jan 2016.
Essentially it seems the economy has been plugging along for two years neither in outright recession nor in an obvious growth mode.
The question going forward is whether tax and regulatory reform promised by the Trump administration is (a) going to actually occur and (b) will provide the expected kick to growth the market expects? And will they overcome any hindrance from an expected restriction on trade?
The market seems optimistic the gains will occur and that should be the direction of trades. Bullish but “nervously” as Cam suggests. It may indeed be a “bull trap” as Cam also suggests but we won’t know until it’s too late. Manage your risk but take a deep breath and get in the game.
Note the CFNAI index and sub-indexes are all available from FRED at the St. Louis Fed.
In a future post you might consider detailing the mechanics of the copper/gold ratio expressed in the last chart of this post. I’m interested how it plays into a larger macro momentum picture.
Thanks for doing what you do.
Here are the key differences between copper and gold.
Gold: A precious metal that reflects the market assessment of hard asset inflationary expectations
Copper: A hard asset commodity (see gold above) that has a higher cyclical demand component
Therefore the copper/gold ratio gives us a better idea of global cyclical demand than either by themselves. Charlie Bilello also pioneered the use of the lumber/gold ratio for this purpose. I believe that copper/gold is a better measure of global cyclicality, whereas lumber/gold is a better measure of US cyclicality, as lumber prices tend to be more regional in nature. See https://t.co/AG35Erywcy