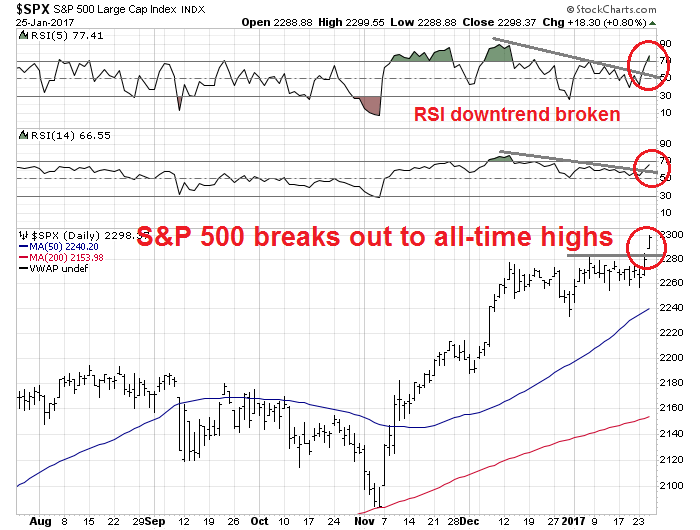
Mid-week market update: Since the time I issued a correction warning in late December (see A correction on the horizon?), the US equity market has traded sideways in a narrow range. Moreover, the SPX has alternated between a seesaw up-and-down pattern since early January – until today.
As the SPX breaks upwards to a new all-time high, and the DJIA breaches the psychologically important 20,000 mark, it’s hard to argue with price and momentum.
Overbought and vulnerable markets can correct in two ways. It can correct through price, with lower prices, or through time, with a sideways consolidation. The latter scenario is often accompanied by an internal rolling correction characterized by weakness in market leaders and nascent strength from laggards, which seems to be what has happened (see The contrarian message from rotation analysis).
The turmoil beneath the surface
Even as the stock market traded sideways for most of January, an anomaly began to develop in the option market. The VIX Index, which is a measure of index volatility, fell as expected, but SKEW rise dramatically (chart via Bloomberg). In other words, the cost of hedging a tail-risk event such as a market crash rose dramatically even as stock prices flattened and volatility fell. In fact, tail-risk fear is at levels not see since the correction last June, which stock prices actually fell.

What gives? Has the market been that nervous about the Trump administration? If so, shouldn’t the VIX Index be rising in anticipation of heightened market volatility? Who is right? The VIX or the SKEW Index?
It turns out that there are perfectly reasonable explanations for the low level of the VIX Index. As this chart of implied (orange line) and historical (blue line) volatility from iVolatility shows, historical, or realized, vol has been falling and therefore it is no surprise that implied vols have followed suit.

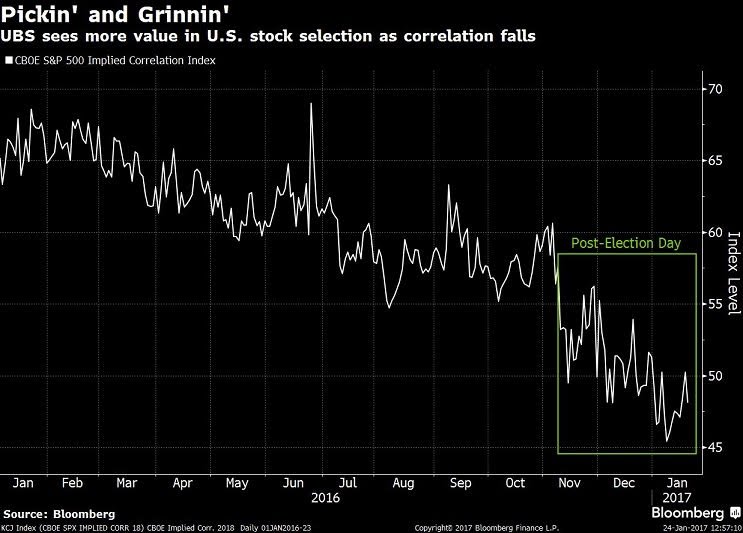
In addition, Julian Emanuel of UBS pointed out that the correlation between stocks have been falling since the election. Lower correlations between stocks create a greater diversification effect, which leads to lower index volatility and lower realized historical volatility. In addition, lower correlations can create the sorts of conditions where rolling corrections can occur, which is precisely what seems to have happened.
I have been wrong before and I am wrong now, as Mrs. Humble Student of the Markets have pointed out to me on numerous occasions. I mis-interpreted the rolling corrections, where cyclical sectors weakened and defensive sectors began to outperform as signs of weakening internals (see The contrarian message from rotation analysis). Instead, they turned out to be a healthy rolling correction.
Markets are breaking out
In the meantime, the markets have staged a broad based rally. The chart below shows that the DJ World Index has risen to new highs, just like the SPX. Even though the European averages have not rallied to new highs, they are displaying signs of strength.

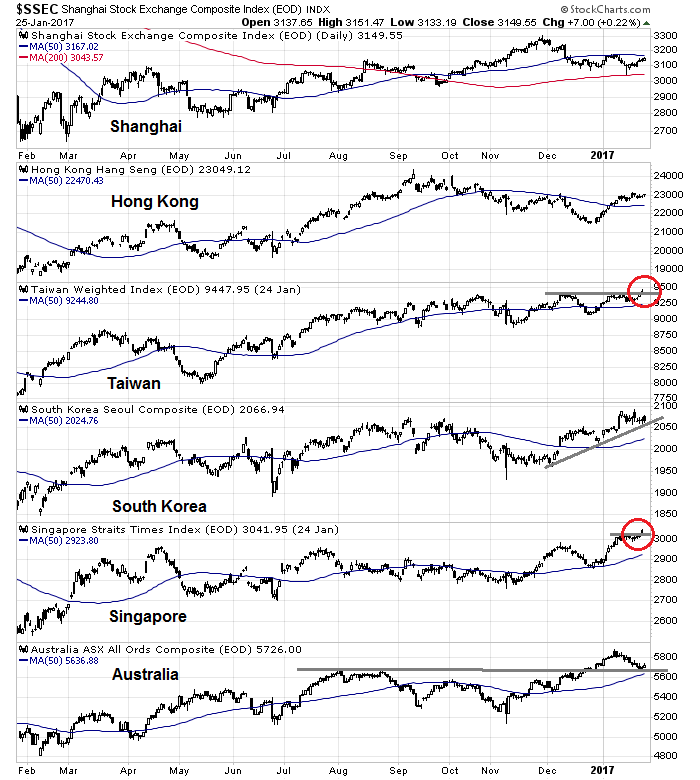
Similarly, the Asian markets of China and her major trading partners are all well above their 50 day moving averages.
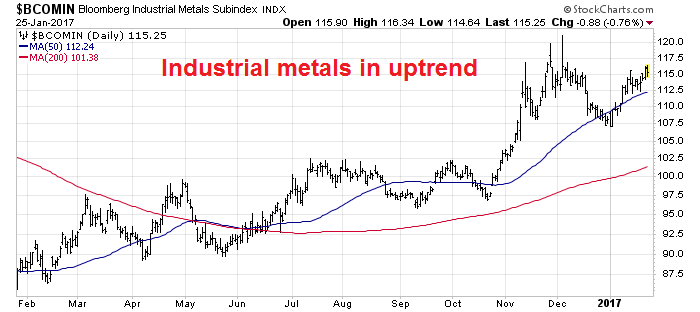
The cyclically sensitive industrial metals are also in a healthy uptrend.
What’s not to like?
Key risks
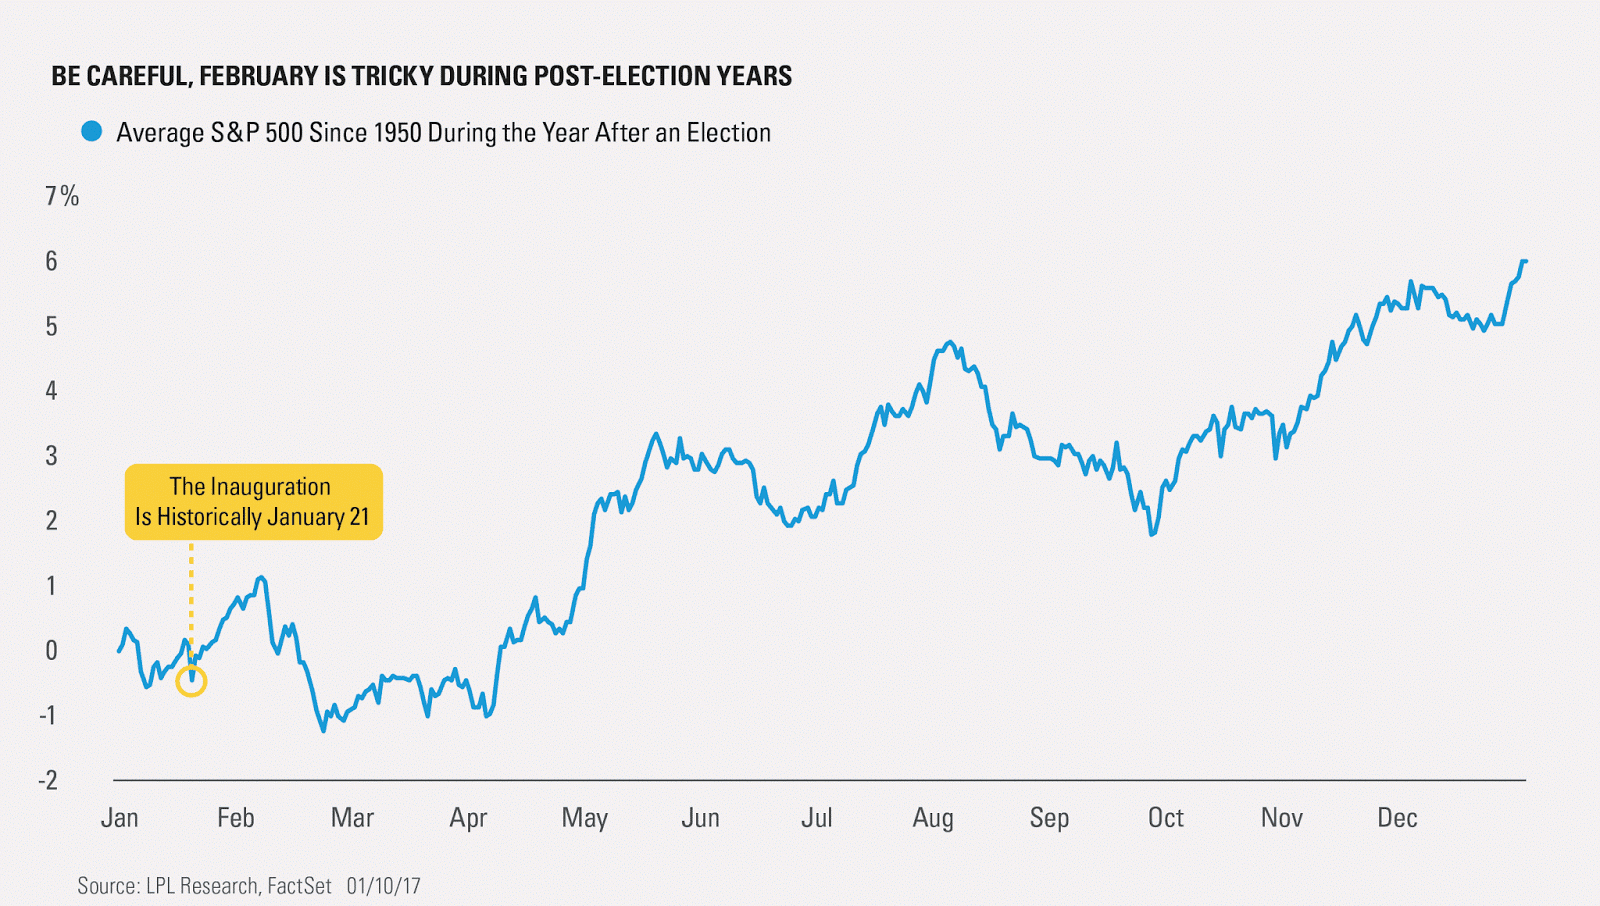
One of the key risks is this rally could turn out to be a bull trap. Ryan Detrick of LPL Financial observed that the market tends to rally after Inauguration Day, with a peak in early February. Could history repeat itself?
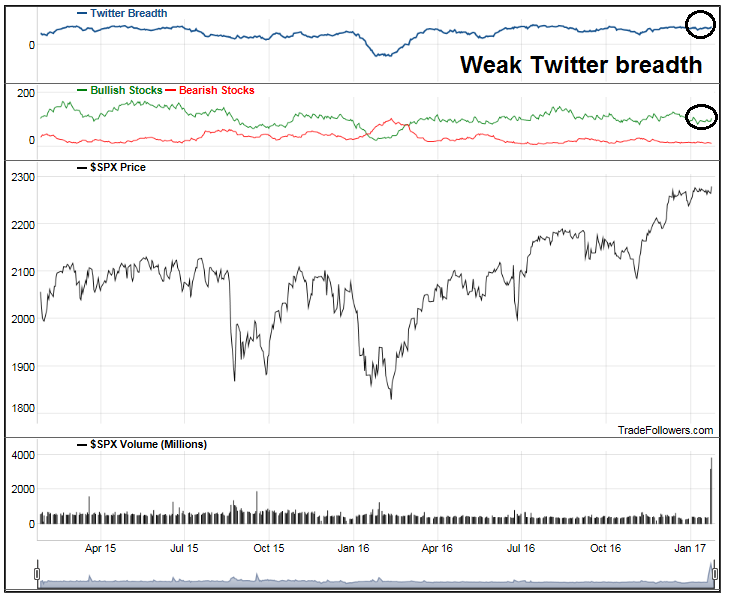
In addition, this chart from Trade Followers shows that Twitter breadth remains weak, which does not exactly inspire a great deal of confidence in the current upside breakout.
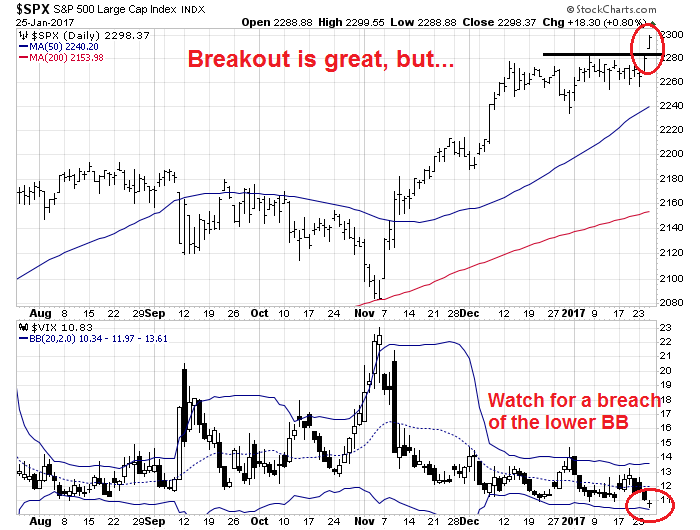
My inner trader has changed from a small SPX short position to a small long SPX position with a tight stop (don’t ask me how tight, because my pain threshold will be different from yours). Should the market rally further and VIX Index breach its lower Bollinger Band, that will be an overbought signal to realize profits and take some chips off the table.
Disclosure: Long SPXL