In my post written last weekend (see Watch the reaction, not just the Fed), I suggested that the key to future stock market trajectory was not just the FOMC statement, but the reaction to the statement and subsequent press conference:
- What happens to the dot plot?
- How will the market react to the Fed’s message? Will the current market expectations of about two more rate hikes in 2017 change?
- How will Donald Trump react to the likely quarter-point rate hike?
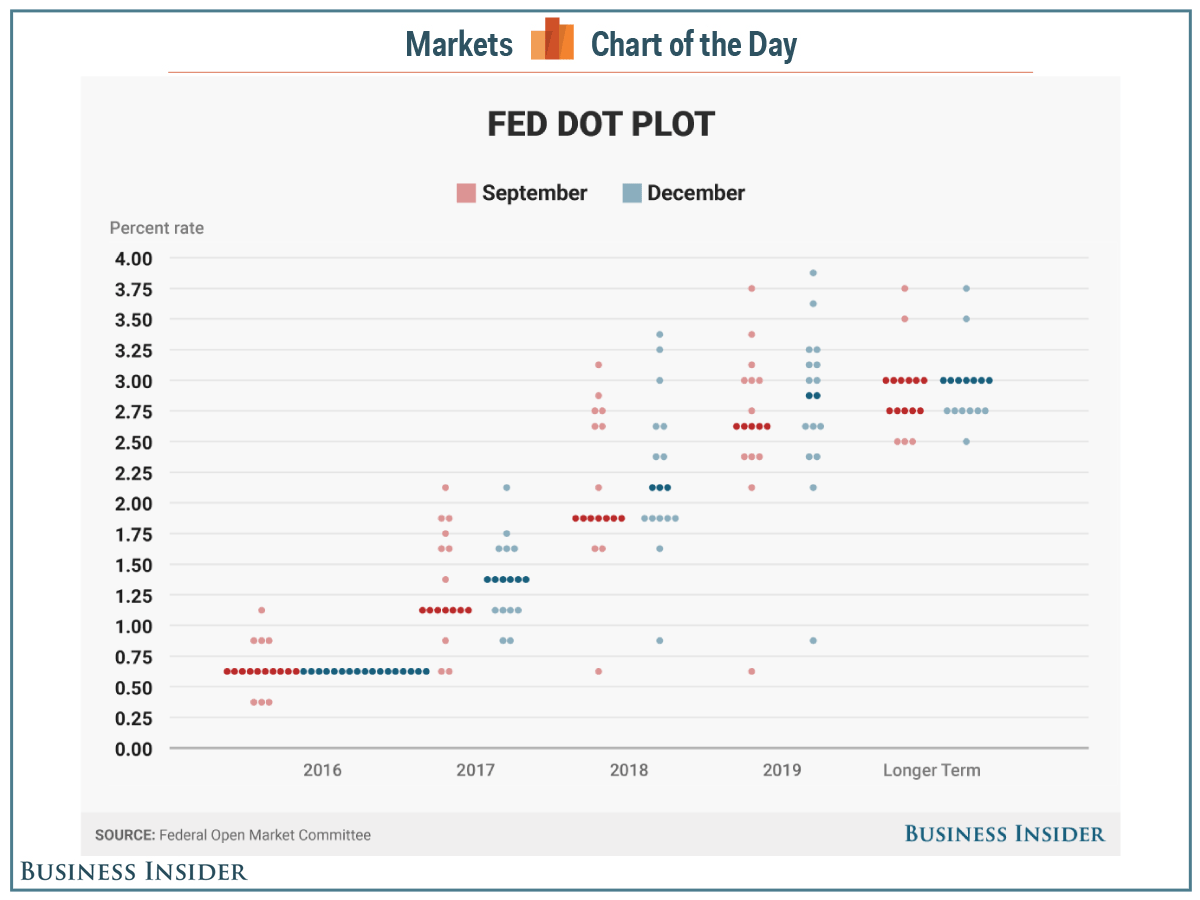
I had expected a stand pat Summary of Economic Projections (SEP), otherwise known as the “dot plot”. Instead, the FOMC shaded up the dot plot, which suggests that 2017 will see three quarter point rate hikes instead of two (chart via Business Insider).
The market reaction was understandably negative. Stock prices fell. Rates rose across the board, but the 2/10 yield curve steepened, which indicated market expectations of better growth.
Here is my perspective on the new dot plot and subsequent market reaction.
Bernanke on the “dot plot”
Former Fed chair Ben Bernanke recently wrote about how to use the “dot plot”, or SEP. Here is how not to use the SEP.
- It is not a policy commitment by the FOMC
- It is not an unconditional economic forecast
More revealing was his comment that investors should think of the SEP as a straw poll:
The FOMC is not a simple democracy but a consensus-driven organization, with the agenda set by the chair. Only twelve of nineteen participants have a vote at each meeting. Consequently, it is not straightforward to infer FOMC policy by looking at the median SEP projection of rates or other variables, without benefit of other information. Still, in conjunction with speeches and other public comments, the SEP does provide timely quantitative information about the range of views on the committee and how the thinking of participants is evolving. I think of the SEP as a straw vote, a reflection of the range of sentiment going into the full committee debate.
Does the SEP straw vote predict actual FOMC decisions? Interest-rate projections in particular are still a relatively recent innovation, so the data seem insufficient at this point to give a clear answer to that question. The SEP released after the September FOMC meeting showed a strong majority of committee participants (all but three) expecting another rate increase this year, and an increase does seem likely for December. On the other hand, recently, SEP rate projections over longer horizons have been too optimistic about the ability of the economy to sustain rate increases (for example, as of a year ago many participants saw four rate increases in 2016). As discussed further below, however, I believe that discrepancy is explained by systematic changes in participants’ outlooks in light of new economic information, not by the failure of the SEP to capture the range of views at a particular moment in time.
In other words, the dot plot represents individual FOMC members’ views of interest rate projections given all of each person’s view of how the economy is likely to develop. So what are we to make of the new development where the “dot plot” now expects three 2017 rate hikes instead of two?
From the market’s perspective, the combination of rising yields and a steepening yield curve indicates that bond market continues to focus on higher growth expectations. The steepening yield curve is directly contradictory to the reflex sell-off in stock prices. If the bond market’s verdict is to be believed, then this development should be interpreted as equity bullish.
What about Trump?
The one missing ingredient to the FOMC announcement was the reaction from PEOTUS Donald Trump. On one hand, the change in the “dot plot” from two 2017 rate hikes at the pre-election September meeting to three rate hikes could be seen as a challenge to the incoming president’s agenda. Not only did the Fed raise rates in December, it went on to signal a faster pace of rate normalization in 2017.
On the other hand, if Trump were to appoint any of his hard-money supporters to the two open positions to the Federal Reserve board, they are likely to be more hawkish than the current FOMC. Potential board members from the “audit the Fed” and hard-money school are likely to support a rule-based approach to monetary policy, such as the use of the Taylor Rule to set interest rates. I indicated in my weekend post (see Watch the reaction, not just the Fed) that my Taylor Rule estimate puts the target Fed Funds rate at 2.8%, which is significantly above the even raised Fed Funds target.
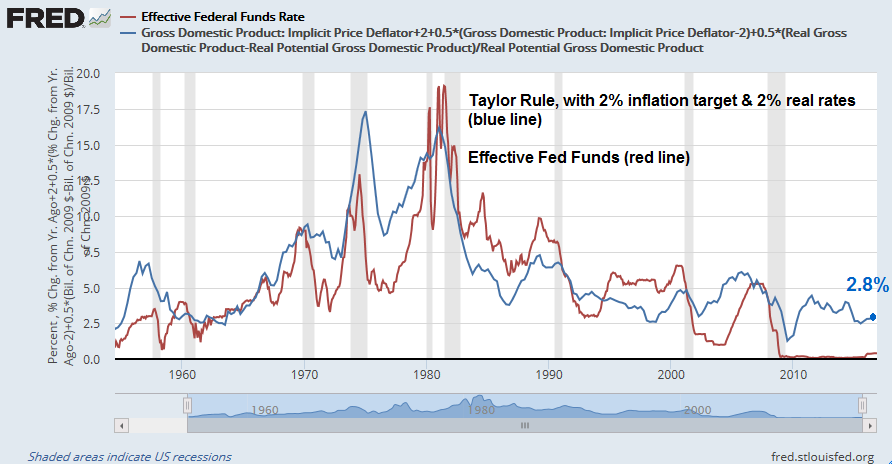
Further analysis by Holger Zschaepitz of Die Welt using his Bloomberg terminal showed that the Taylor Rule target is even higher at 4%: Everything else being equal, the adoption of an equilibrium Fed Funds rate of between 2.8% and 4.0% is likely to accelerate the pace of rate hikes, which would largely negate the pro-growth effects of Trump’s fiscal policy stimulus.

So we are left waiting for the next shoe to drop. What will Trump say? Will he go on Twitter and criticize the Fed for adopting a more hawkish outlook, or will he acquiesce to hard-money supporters and prefer an even aggressive pace of monetary tightening?
Watch this space.
Is there anything especially sacrosanct about the so called Taylor rule? The Fed is surely aware of what happened in 2007 as Bernanke kept raising rates. what if the FFR just gets to 1.25 or 1.50 in 2017? The rate on the 10 year is equally important. We can all be sure that Trump will use the Twitter-Pullpit to criticize any one and any thing. If the 10 year goes past 3.25% he might demand that the Fed use QE IV to buy treasuries to lower the yield to prevent mortgage rates from going too high. He is the most interventionist President since FDR. Robert Millman