Mid-week market update: Today’s market action should be a lesson to me to change model rankings based on overnight futures prices, which trades in a thin and volatile market (see What now?). To set the record straight, the Trend Model did not move to a neutral, or risk-off reading based on today’s market action. The change last night was based on ES futures falling 3-4% at the time of writing.
One common refrain made by politicians who concede elections is, “The people have spoken!” In this case, the market has spoken and it has decided to adopt the bullish view that Trump is a reflationary president, rather than the bearish view of Trump the protectionist. This interpretation was made evident by the rally in the cyclically sensitive industrial metals, even as gold prices fell.

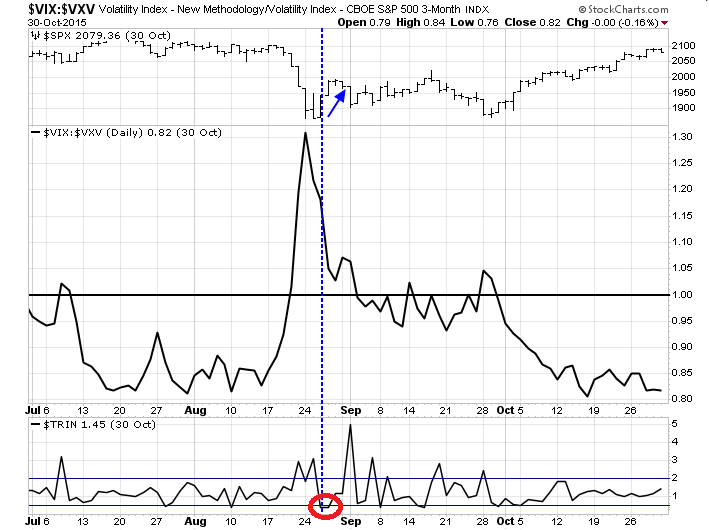
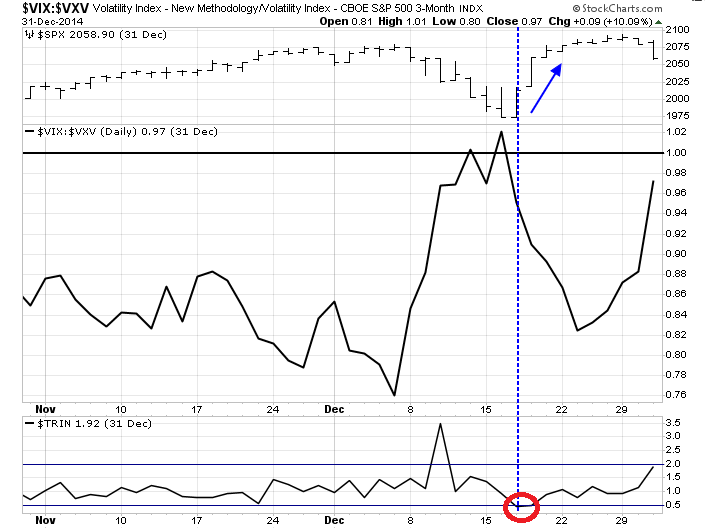
From a technical viewpoint, the stock market’s behavior is showing a path to an uber-bullish outcome. As the chart below shows, the market is showing the combination of a fear unwind, indicated by the normalization of the VIX term structure from an inverted state, and two days where TRIN has dipped below 0.50, which is a signal of a buying stampede.

Such momentum have either resolved themselves into periods of extended bullish momentum, or fizzled out within a few days.
The historical record
I went back to 2008 and looked at past episodes where such circumstances have repeated themselves. In 2015, TRIN fell below 0.50 while the VIX term structure was normalizing. The market rose for two days and stalled.
In 2014, the continued to advance for ten days after the signal.
In 2013 and late 2012, stock prices continued to rise for quite some time after the two signals.

There were several instances of these signals in 2011. Most stalled within a few days, but the last one in October marked the start of a sustained advance in stock prices.

In 2010, the market stalled after the signal.

The market bottom in 2008 and 2009 saw several instances of this signal. Some were decent trading signals with advances that lasted for about a week. More importantly, the market saw such a signal when it made its possible generational bottom in March 2009.

So where does that leave us? The historical evidence indicates that the combination signal of buying stampedes as fear fades yields sustainable advances about one-third of the time. One way is to trade these episodes is to get long, but with tight trailing stop losses.
A ZBT buy signal setup
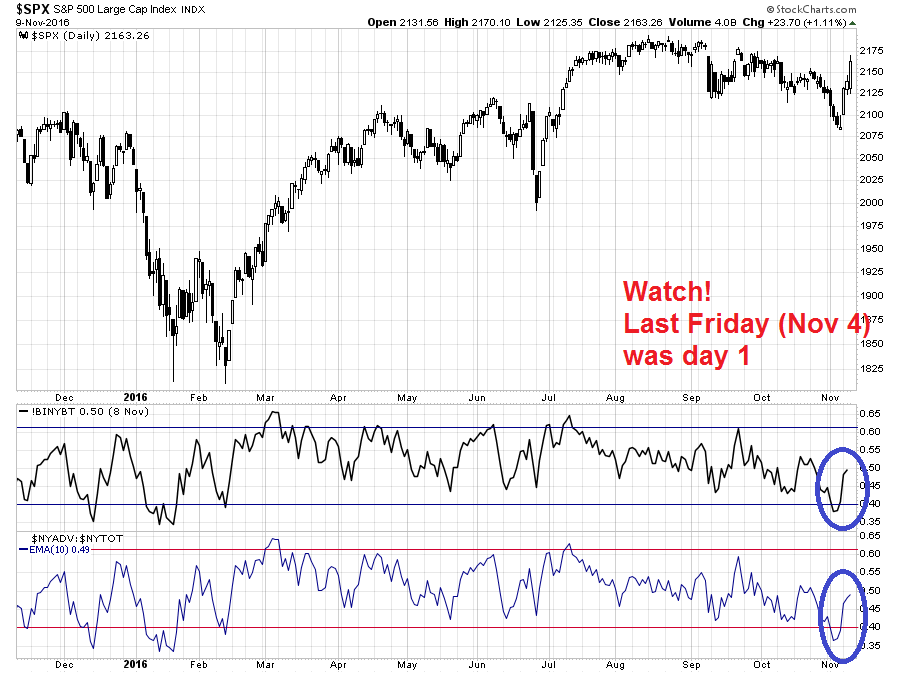
As price momentum is the main component of these advances, there is another possible buy signal that the market could be setting us up for, namely the Zweig Breadth Thrust (see Bingo! We have a buy signal!). Steven Achelis at Metastock explained the indicator this way:
A “Breadth Thrust” occurs when, during a 10-day period, the Breadth Thrust indicator rises from below 40% to above 61.5%. A “Thrust” indicates that the stock market has rapidly changed from an oversold condition to one of strength, but has not yet become overbought.
According to Dr. Zweig, there have only been fourteen Breadth Thrusts since 1945. The average gain following these fourteen Thrusts was 24.6% in an average time-frame of eleven months. Dr. Zweig also points out that most bull markets begin with a Breadth Thrust.
As the chart below shows, the ZBT Indicator (second bottom panel, bottom panel a real-time estimate) moved off its oversold level last Friday, which was day 1. The market therefore has 10 trading days to get the indicator up to 61.5%, which is not an easy task. Readers who want to follow along at home can use this link to get a real-time update.
Should we see an actual ZBT buy signal, there will undoubtedly be lots of skeptics as the market will be challenging or breaking out to new highs. Many traders will think that it will be too late to be buying. However, momentum thrusts are funny that way, as their strength can extend a lot further than you think.
My inner investor remains constructive on equities. My inner trader was fortunate not to get stopped out of his long positions at the open this morning. He remains long equities.
Disclosure: Long SPXL, TNA
This is a chart showing the performance of U.S. industry group ETFs from election night onward.
https://product.datastream.com/dscharting/gateway.aspx?guid=c7137a77-5f35-4545-8281-46204fed339a&action=REFRESH
This one shows the performance of key international ETFs from election night forward.
https://product.datastream.com/dscharting/gateway.aspx?guid=3a3e478a-c51e-499a-9e6e-745f9687d305&action=REFRESH
Keep them by cutting and pasting them somewhere. Today they only show one day’s performance but they will update automatically every day forward. A great way to monitor leadership in this new Trump stock market.
I bought U.S. Bank ETF and Energy ETF today. These two industries are much better in a Trump presidency. Others, such as healthcare may also but I don’t understand the Obamacare/no Obamacare argument as it applies to profits of the healthcare industry players. Every country ETF on the chart underperformed the S&P 500 by a wide margin today.
I am a momentum investor. When an important trend-changing event happens, I chart the players and own the winners as long as they are outperforming the SPX. I start with major industry groups, then possibly look at sub-groups and finally possibly individual stocks within the outperforming sub-group.
After the surprise Trump victory, I will stay with ETFs rather than stocks within the ETF. Why, because I am confident the Bank ETF will outperform. I don’t want to buy a bank stock and hear that they have individual bad news causing me to miss a predictable large industry trend..
The U.S. is clearly looking inward and this will likely hurt international trade and international stock markets. The effect is clearly seen on the international chart above with important country ETFs.
Today, I read so much commentary in financial media recommending waiting until after the smoke clears before doing anything. I beg to differ. It is hard to buy when one sees a stock has already jumped higher in price. I’ve learned it’s best to steel oneself and buy if you think the event has long lasting consequences and a new long term trend has begun. It’s not less risky to wait and pay higher prices.
“The market has spoken”: yes, but the market can only presume at this point. One little conciliatory speech, and the market hopes were now looking at Donald2000 (with a strong inner Roosevelt-Democrat, who liked to build things). And not Caudilllo Donaldo, the South American authoritarian who locks up people he dislikes, surrounds himself with strongmen/thugs, and is a proto-protectionist. Or, amateur Donald, an erratic, ineffective old man who gives regulatory jobs to corrupt cronies.
Momentum strategies often do not work in a trendless or uncertain market. Tight stops only help against major losses when the trendless period does not last more than a few weeks. I got whipsawed often enough in 2015 to have learned my lesson. I will be looking forward to further excellent guidance from Cam, and I might dabble in some of Ken’s ETFs (thank you!, Ken), but otherwise, for me a wait and see approach sounds most prudent.
Hi Cam,
I tend to agree with @martin above. Compatible with your statistics above, people could probably front run the Don’s expansionary policies in the stock market for a few more percentage points without much info on what the Donald’s gonna do, level of congressional support for more debt, who he chooses to be in his cabinet, etc. Plans to upgrade infrastructure will also take a reaally long time before coming into fruition as suggested by this article: http://www.forbes.com/sites/timworstall/2015/09/14/in-the-modern-economy-infrastructure-spending-simply-can-never-act-as-stimulus/#175e14c825d2
So assuming there’s no new information from Trump do you think the market can break to new highs or will it be sideways for now? Do you think Donald can increase the GDP in 2017 by boosting infra spending or will it require time before having any material impact on the economy? And lastly do you have any opinion on what is a reasonable yield for the 10 year treasury now?
Thanks!
P.S. Higher yield can compromise the high PE promised by the There Is No Alternative strategy.
How ironic if Trump’s win turns traders back into investors.
Cam: Could you post or send me a chart of the Trend Model w trading dates. The 1st chart you post on weekend is the Trading Model. I’ve never seen the Trend Model & that would be most useful. Thanks.
Cam: inner trader uses trading component of trend model to look for changes in direction of trend model,why inner trader didnt get sell signal.previously inner trader got sell signal for even 2-3/% fall like in february.
Thanks cam.